Contents
Key terms used in this article
Executive summary
How France became fiscally vulnerable
Long-run fiscal evidence, policy choices and the correction challenge
Why French borrowing costs rose: the spread level and its change
What the latest French yield and CDS repricing reveals
How France’s repricing spread across other European government bonds
France compared with four European sovereign peers
How French sovereign stress affects euro exchange rates
Historical FX test: French spreads and euro exchange-rate behavior
Synthesis: when sovereign stress reaches the euro exchange rate
Bank credit: Lessons from a small cross-country sample
French government-bond auctions: how investor demand evolved
Six historical episodes chosen to test sovereign transmission across Europe
Policies that could slow or stop repricing and fragmentation: PEPP and TPI
A four-stage monitoring framework
What the data say about the current stage as of October 25
ECB-rate expectations reaction
Four forward paths mapped to the state framework
Political and market checkpoints from October 25 onward
Conclusion
Methods, data definitions and reproducibility
A1. Main sovereign decomposition
References and source links
Key terms used in this article
OAT: a French government bond. “Bund” refers to a German federal government bond. A basis point (bp) is one hundredth of a percentage point, so 100bp equals one percentage point.
Euro interest-rate swap (EUR IRS): a contract in which counterparties exchange a fixed euro interest rate for a floating rate. We compare five- and ten-year French and German government yields with EUR IRS quotes of the same maturity. These swaps reference six-month Euribor, which includes banking and liquidity influences; the swap rate is not a pure risk-free rate. When we say a bond “cheapens versus swaps,” we mean its yield rises relative to that benchmark. [5] [8]
€STR overnight-indexed swap (OIS): a swap referencing the euro short-term overnight rate, often used to assess expected ECB policy rates with fewer bank-credit effects than Euribor-linked IRS. IRS and OIS give related but different benchmarks. Our current-episode decomposition uses daily publicly observable IRS quotes; ECB historical analyses are reported in their original OIS conventions.
Sovereign CDS premium: the annual insurance price, quoted in basis points, for protection against specified government-debt credit events. Widening from 35bp to 80bp means insurance becomes substantially more expensive, reflecting higher perceived risk or risk aversion; the quote is not itself a default probability.
Bank CDS premium: an insurance quote on a bank’s debt. A wider premium can reflect concerns about loan losses, sovereign holdings, wholesale funding or general market risk. It is a signal to compare across several banks and alongside deposits, funding rates and equity prices.
Bid-to-cover: total competitive bids divided by the amount allocated at an auction. A ratio of 2.0x means investors submitted twice as much demand as the Treasury awarded. It is a primary-market demand-coverage measure, not a direct measure of secondary-market liquidity.
Redenomination risk: the risk that debt currently payable in euros is converted into a new national currency following an exit or breakup. If that successor currency is expected to depreciate, investors can suffer a loss even without a conventional default. Researchers estimate this risk using differences between sovereign CDS contracts with different contractual treatment of currency redenomination. [19] [20]
Fragmentation: in this article, the word is reserved for more than ordinary differences in sovereign credit quality. It means a widening dispersion in financing conditions that begins to impair the transmission of the ECB’s common monetary-policy stance across countries. Selective repricing of weak versus strong sovereigns is therefore not automatically “fragmentation.” [15] [16]
Executive summary
On October 23, France’s 10-year government-bond yield closed in the 5.03%–5.05% range, and the spread over Germany’s 10-year yield stood near 168–172 basis points (bp). French five-year sovereign credit-default-swap (CDS) premiums reached 96.23bp on October 22, up from 77.36bp on October 7. Higher bond yields raise the marginal cost of refinancing French debt; wider CDS premiums indicate that investors demand more compensation for French sovereign credit risk. [3] [4] [10] [46] [52] [53]
Our first observation is that French borrowing costs rose more rapidly than German borrowing costs during the final October selloff. Between October 7 and October 23, the 10-year France–Germany yield gap widened by 29.61bp. Measured against the same euro interest-rate swap, the French bond premium widened 29.00bp, accounting for 97.9% of the bilateral change. The five-year French component explains 97.8% of the corresponding spread change. The swap calculation measures which bond market repriced relative to a common benchmark; the fiscal, political and liquidity mechanisms behind that move are examined separately. [3] [4] [5] [6] [7] [8]
Our second observation is that the late-October acceleration was concentrated in France, following wider European sovereign differentiation earlier in the episode. Between October 7 and October 23, five-year government yields rose relative to the common euro swap rate by 31.0bp in France, 7.9bp in Italy, 2.0bp in Spain and 4.2bp in Austria; the Netherlands fell 0.4bp. Across the four peers, Italy and Spain remained more expensive relative to Austria and the Netherlands, but the peer-group gap increased only 3.05bp during this later period. [6] [8] [9] [49] [50] [51]
Our third observation concerns the euro exchange rate. Between ECB daily reference fixings on October 7 and October 23, EUR/USD rose from 1.1177 to 1.1193 (+0.14%), while EUR/CHF fell from 0.9309 to 0.9227 (−0.88%). French bond stress therefore coincided with different movements against the dollar and Swiss franc. Relative interest-rate expectations, global risk appetite, energy costs and capital flows all matter for interpreting these currency pairs. [41] [68]
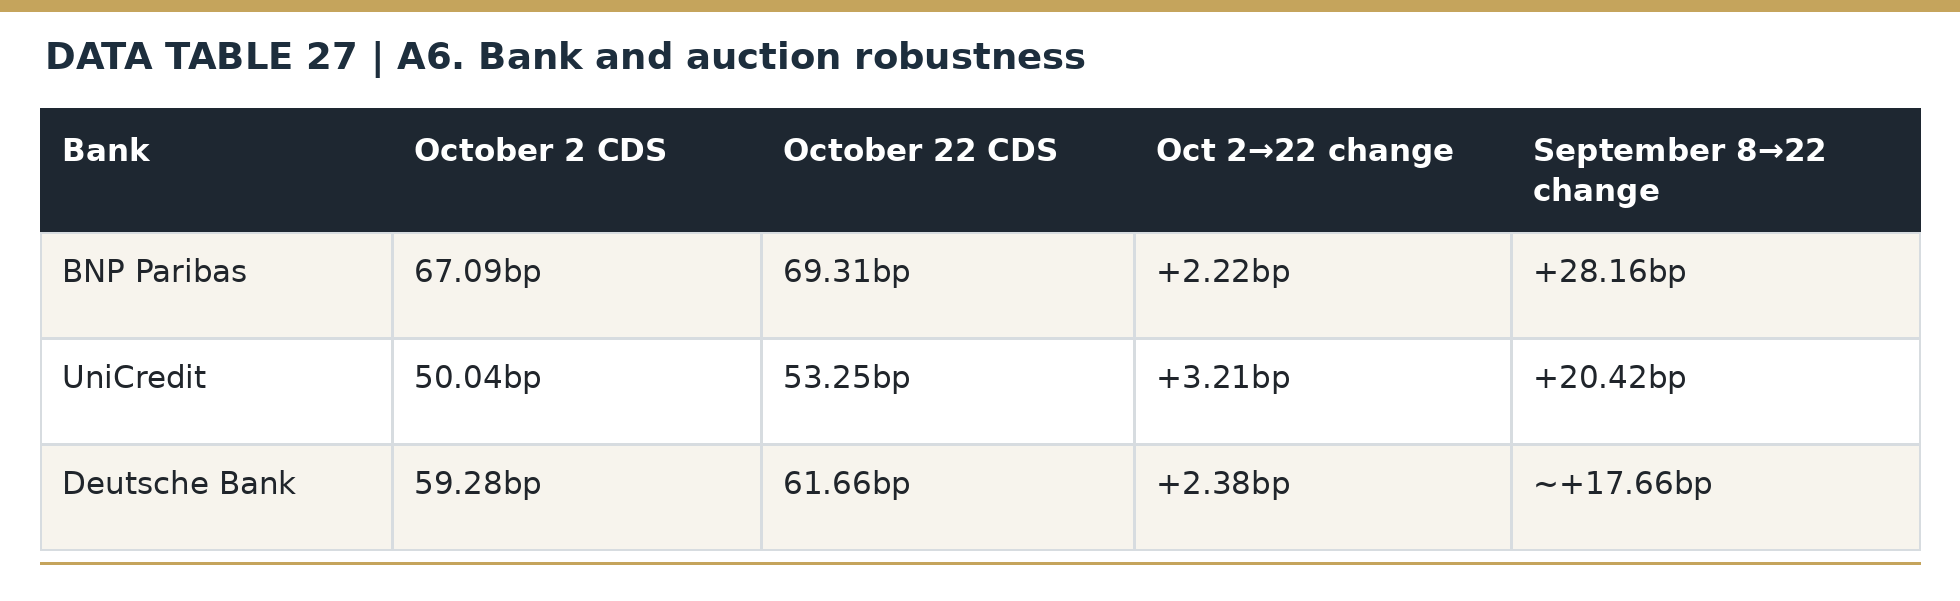
Five-year bank CDS premiums provide a second credit-market perspective. From October 2 to the latest October 22–23 observations, quoted premiums rose by 2.22bp for BNP Paribas, 8.10bp for Société Générale and 5.50bp for Crédit Agricole, versus 3.21bp for UniCredit and 2.38bp for Deutsche Bank. Widening raises the market price of protecting bank debt and can precede more expensive wholesale bank financing. The three French observations together show broader French-bank repricing than a BNP-only comparison. [11] [12] [13] [72] [73]
France continued selling government bonds despite the repricing. Across the ordinary long-term OAT auctions in June, July, August and September, total bids represented roughly 2.51–2.68 times the amount allotted; at the October 1 auction this fell to 2.29 times. For the same bond maturing in November 2036, bid-to-cover declined successively from 2.41 times in June to 2.00 times in October, while its auction yield rose from 3.80% to 4.93%. Investors continued bidding, but their demand coverage weakened while financing became costlier. [2] [54] [71] [74] [75]
Based on mechanisms observed in past European debt crises, we identified four possible stages: (1) a French sovereign-bond repricing; (2) transmission to other European sovereigns; (3) deterioration of bank funding together with strained bond-market liquidity; and (4) disruption of the ECB’s ability to transmit monetary policy uniformly across the euro area. The data support Stage 2 as the highest stage reached by October 25. Wider peer-country sovereign spreads were persistent early in the episode, but only four of eight five-day tests passed between October 8 and October 23. This suggests that the second-stage pressure has become less even across Europe as France’s own bond premium rose. [9] [10] [35] [44] [49] [50] [51]
An investor selling French bonds can buy German or other euro-area securities without exchanging euros for another currency. The euro exchange rate is therefore affected most when fiscal stress changes expected ECB policy, the risk premium demanded on euro-area assets, international portfolio allocations, or confidence in the currency union. Its behavior must be measured directly.
How France became fiscally vulnerable
France entered October 2026 with public debt near 116% of GDP, a long history of underlying primary deficits and limited parliamentary agreement on spending restraint or revenue measures. The government projected a 2026 fiscal deficit of about 5.4% of GDP and targeted 5.0% in 2027. Together, large borrowing needs and contested consolidation exposed the country to a sharp increase in investors’ required returns. [55] [56] [65]
The fiscal record points to three durable weaknesses: recurring government expenditure remained elevated after earlier crises; some revenue-reducing tax reforms were implemented without matching structural savings; and expenditure linked to ageing, pensions and health care continued to pressure budgets. These patterns predated the 2026 political crisis and made the debt stock harder to stabilize. [56] [64]
The global financial crisis, COVID-19 and energy-support measures added to public debt. President Emmanuel Macron’s 2024 dissolution of the National Assembly produced a fragmented legislature. Prime Minister Michel Barnier’s government fell in December 2024 over its deficit-reduction budget; Prime Minister François Bayrou’s government lost a confidence vote in September 2025 following a proposed savings package. The resulting implementation risk affected investors’ confidence in future fiscal adjustment. [RC13] [RC14] [RC15]
The immediate policy challenge was the 2027 budget. The government proposed narrowing the deficit to 5.0% of GDP while interest, defense and social-security costs were rising. France’s National Assembly rejected the separate social-security financing bill on October 23, while Moody’s maintained the Aa3 sovereign rating with a negative outlook. These dated decisions highlight the difficulty of converting fiscal targets into legislation. [62] [63] [65]
The causal chain runs from persistent deficits and accumulated debt, through repeated obstacles to fiscal adjustment, to a higher sovereign-risk premium. Global rates and energy costs can intensify the repricing; changing bank credit, bond-market functioning and euro exchange rates can transmit its consequences. Evidence for each link is developed below.
Long-run fiscal evidence, policy choices and the correction challenge
Fiscal drivers: evidence and chronology
This section assembles official expenditure, revenue and debt statistics with dated legislative and rating decisions. Sources [RC1]–[RC22] document the historical fiscal facts; market data through October 23 appear in the subsequent pricing sections.
The long-run fiscal sequence
In the OECD’s 2026 survey, France’s cyclically adjusted primary balance had been in deficit for roughly two decades. Public debt rose from about 60% of GDP in 2000 to approximately 115.5% in 2025. Recurring deficits explain why each new crisis left the country with limited room for adjustment. [RC1]
Three developments amplified that inherited imbalance: expenditure remained high after the 2008–09 financial crisis; some tax relief introduced after 2017 reduced recurring revenue without matching structural savings; and COVID-19 plus the energy shock temporarily expanded borrowing needs. The continued 2023–24 deficit deterioration after emergency relief faded confirms that the structural gap persisted. [RC1] [RC3] [RC4] [RC5] [RC6] [RC7]
Political implementation became the next constraint. Barnier’s government fell in December 2024 during negotiations over roughly €60bn of tax and spending changes. Bayrou’s government lost its September 2025 confidence vote after proposing about €44bn of savings, and Fitch subsequently downgraded France to A+. These events shaped the credibility of later multi-year targets. [RC13] [RC14] [RC15]
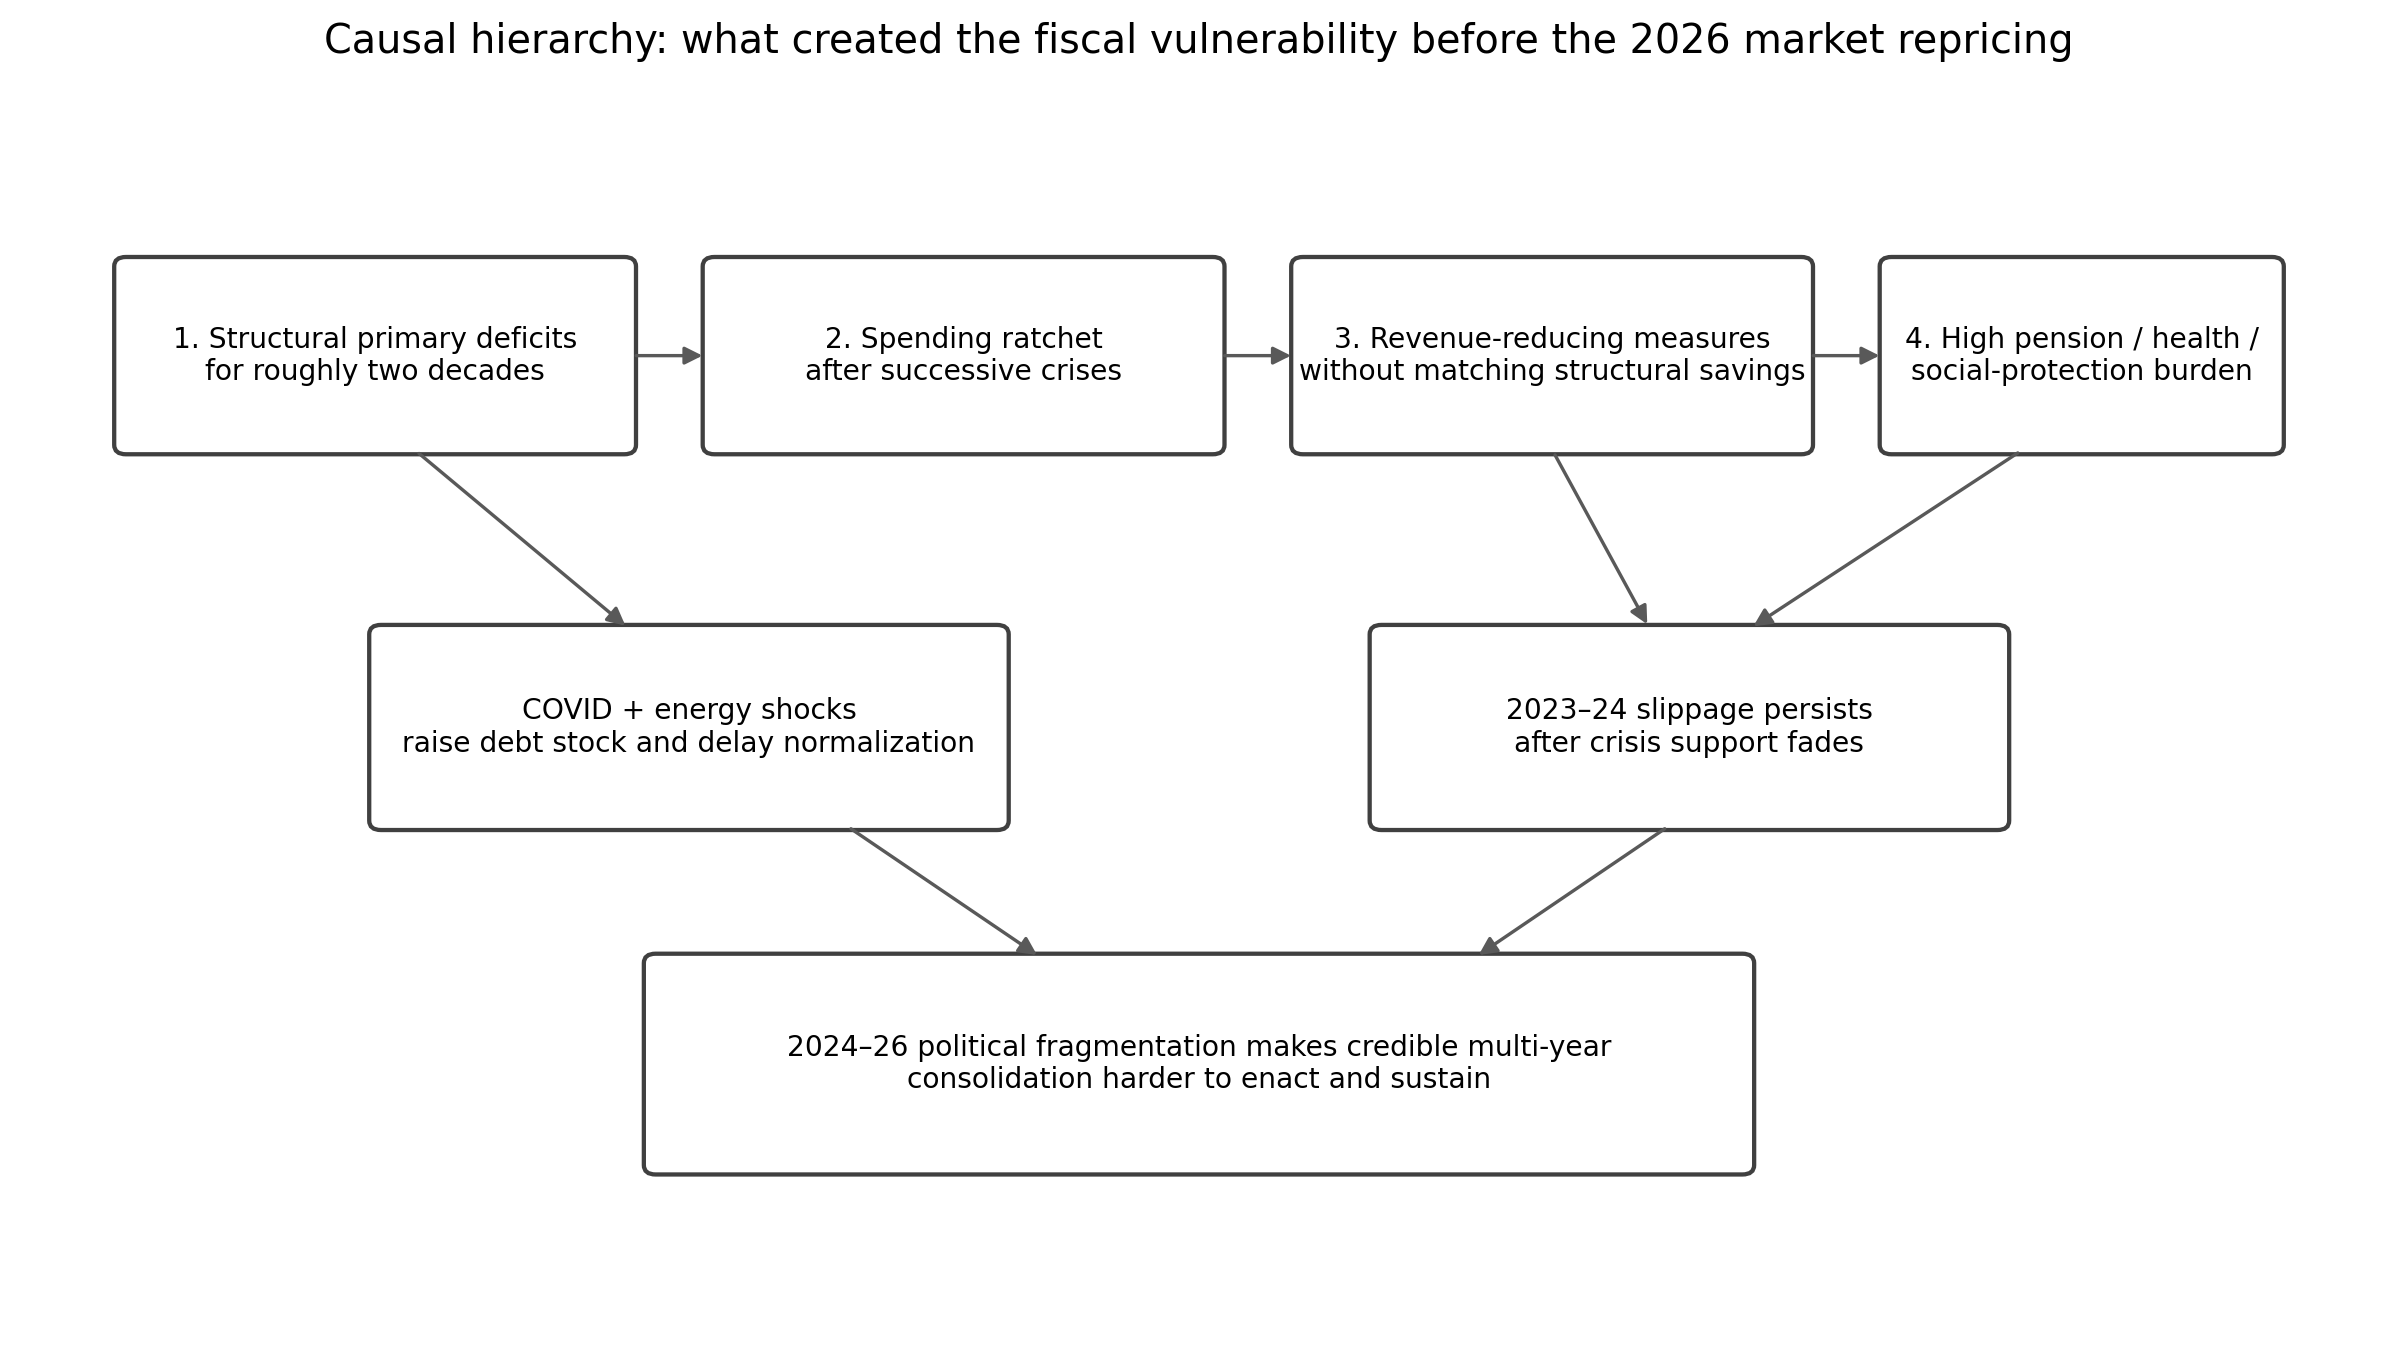
Figure RC1. Causal hierarchy. The boxes above the political layer are documented fiscal drivers; the lower layer describes why correction became increasingly difficult to implement. Sources: OECD, Cour des comptes, Insee and dated budget/political events [RC1]–[RC19].
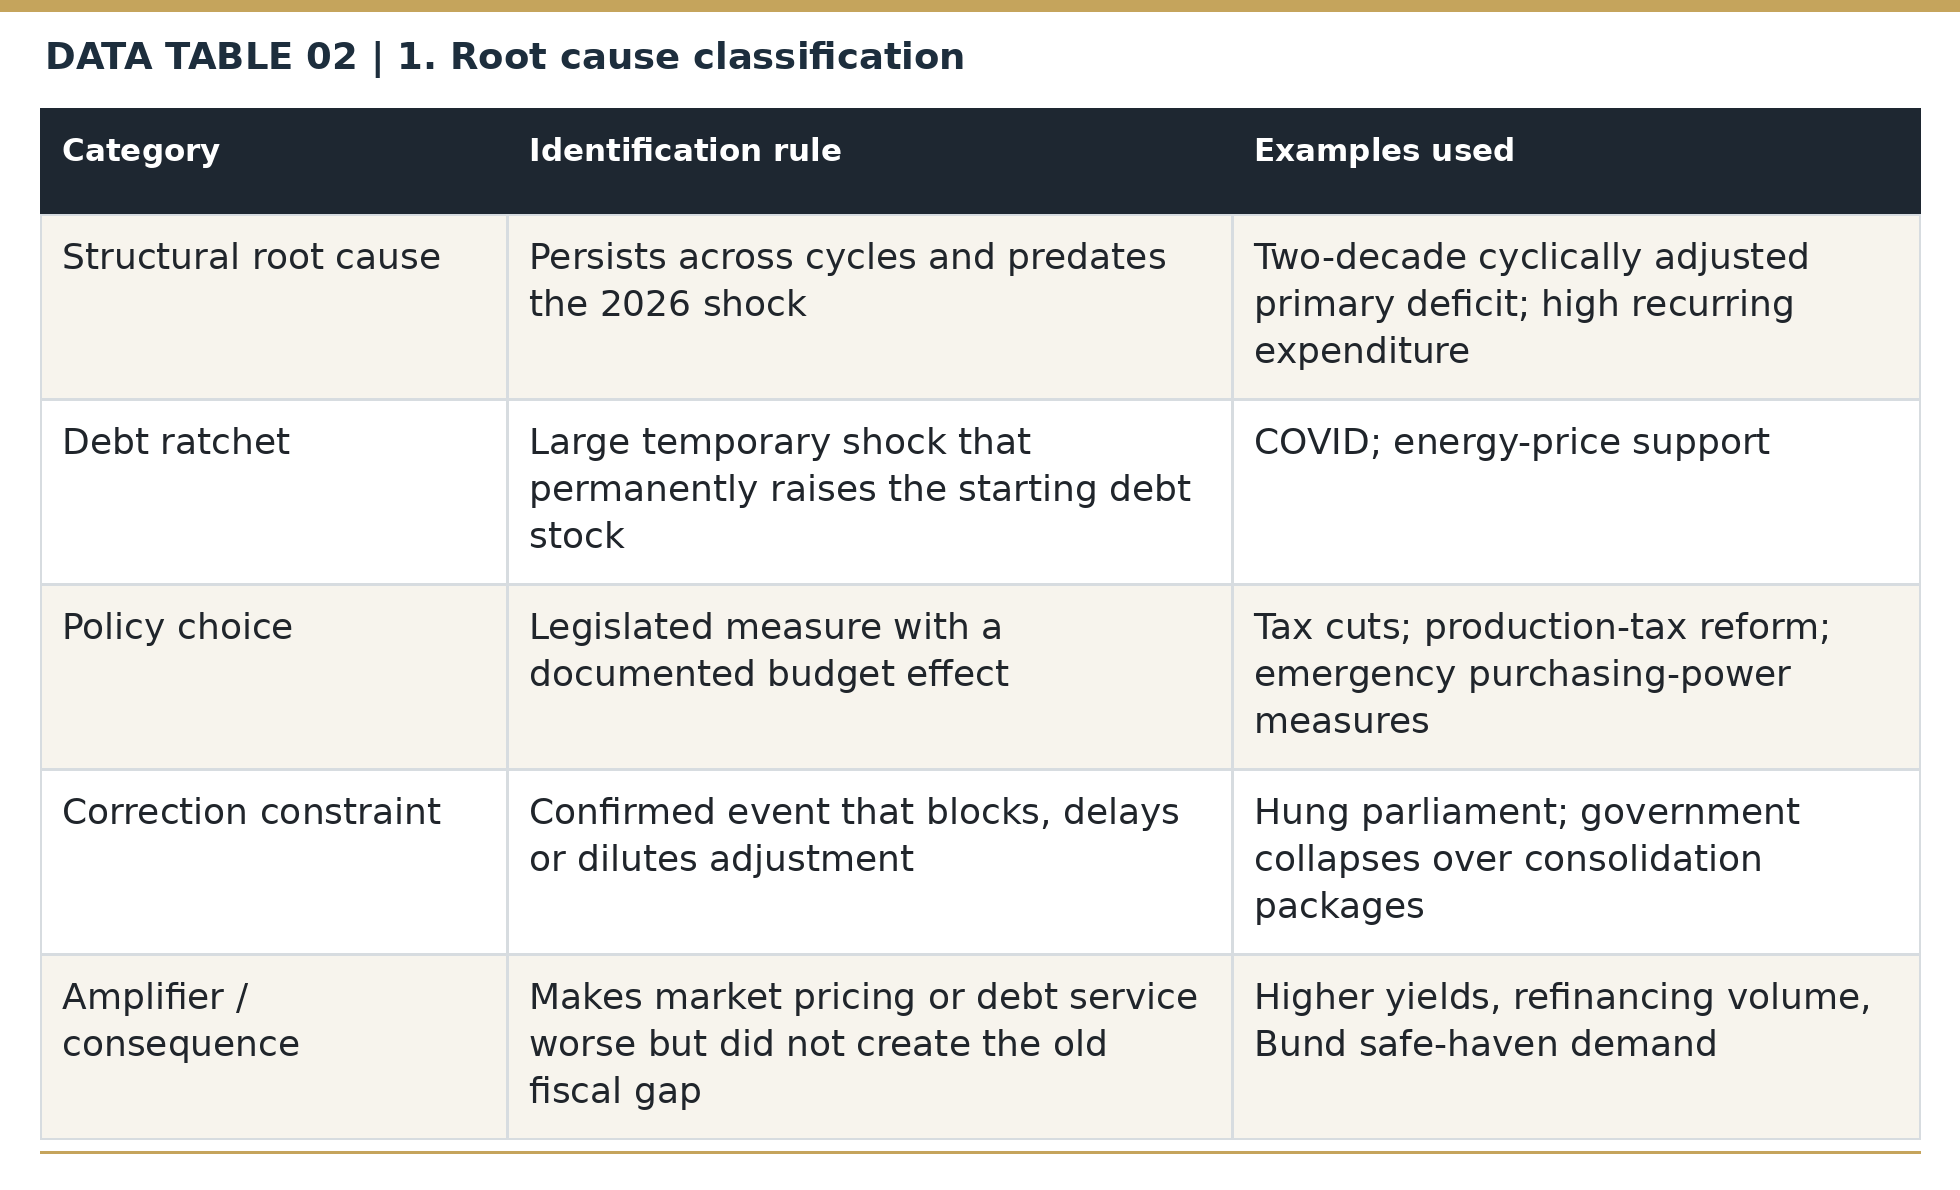
1. Root cause classification
The historical evidence can be organized into structural fiscal drivers (recurring deficits and spending), debt-raising crisis shocks (COVID-19 and energy support), government policy choices (revenue and spending rules), political implementation constraints (parliamentary budget failures), and market amplifiers (higher refinancing yields and supply pressure). [RC1] [RC2]
2. Root cause #1: France entered every recent shock with a structural primary deficit
The strongest long-run evidence comes from the OECD’s 2026 France survey: France had run a cyclically adjusted primary deficit for approximately two decades. The OECD links this to expenditure growing faster and revenue growing more slowly than in peer countries, together with a weaker tendency to unwind support after crises. This matters because debt can keep rising even before interest expense becomes the dominant problem. [RC1]
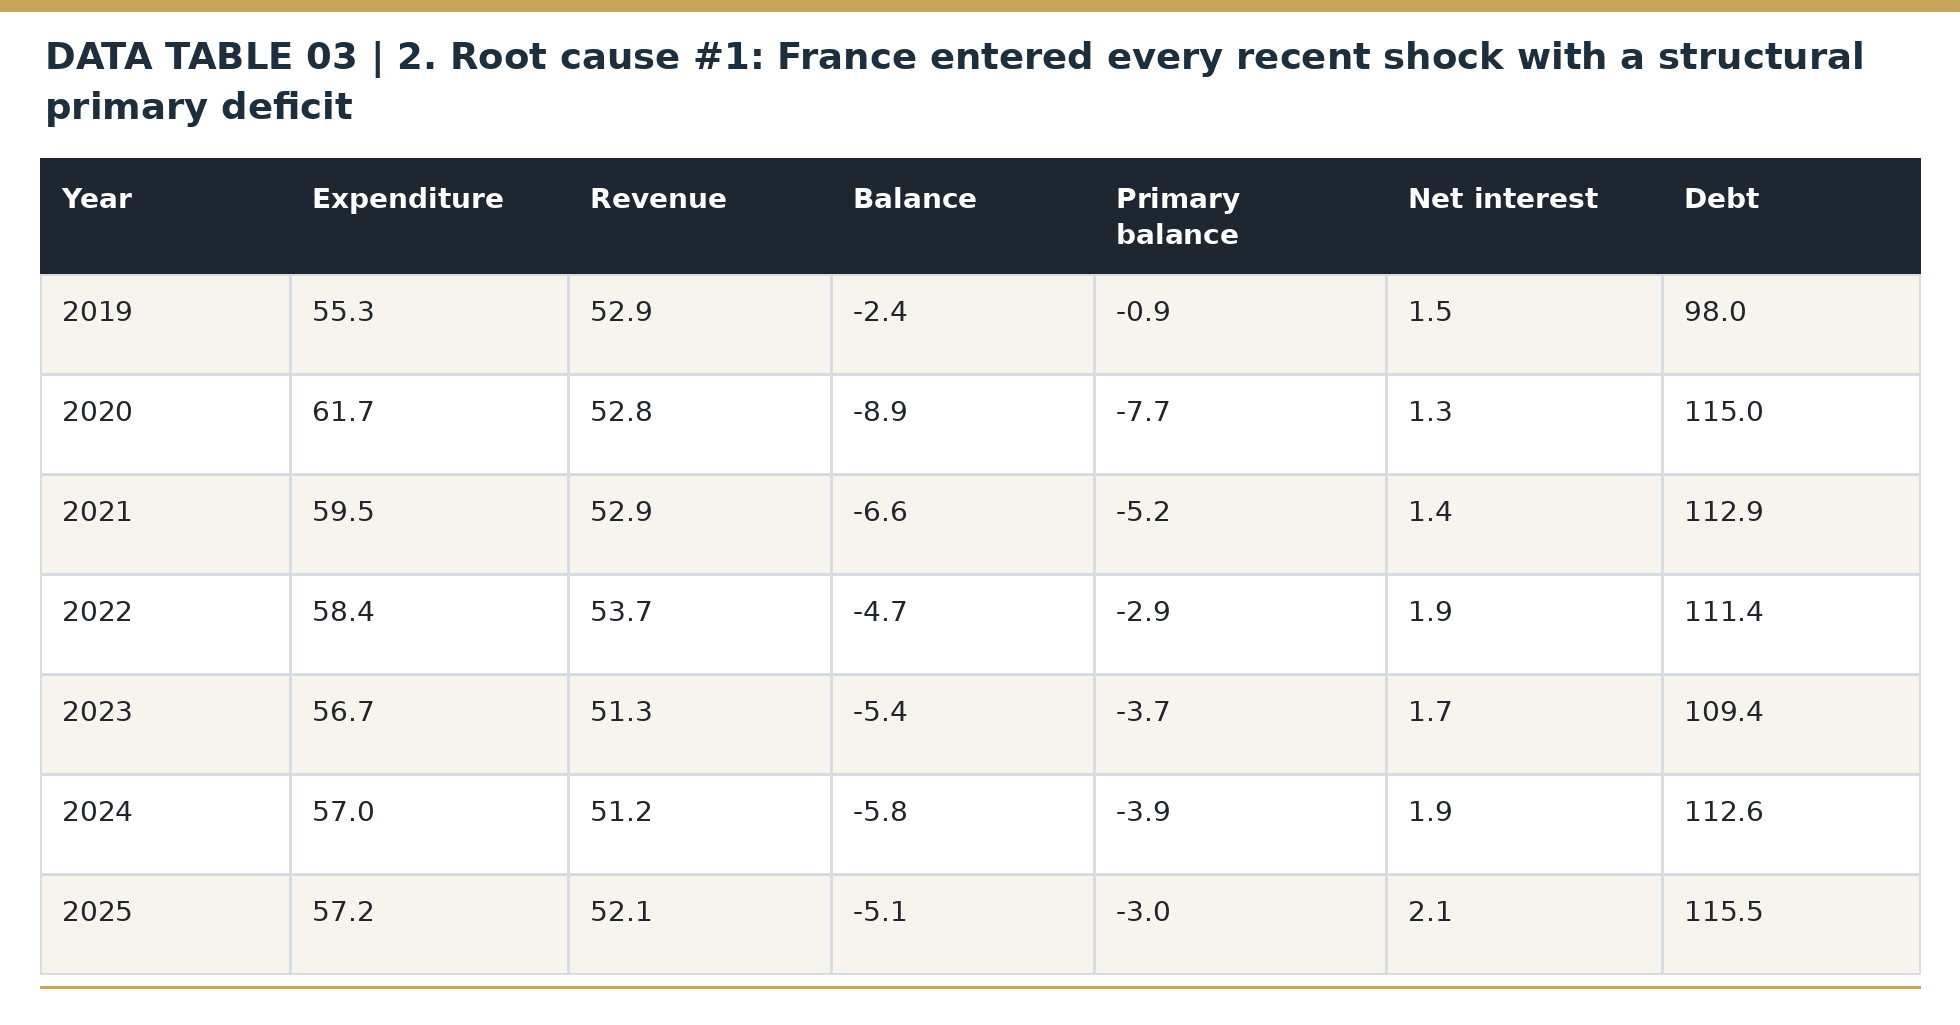
Table RC1. OECD fiscal indicators, % of GDP. 2025 is the OECD 2026 survey estimate; Insee’s subsequent 2025 debt estimate is 115.7% of GDP. The key structural signal is the persistent primary deficit after emergency measures receded. [RC1] [RC2]
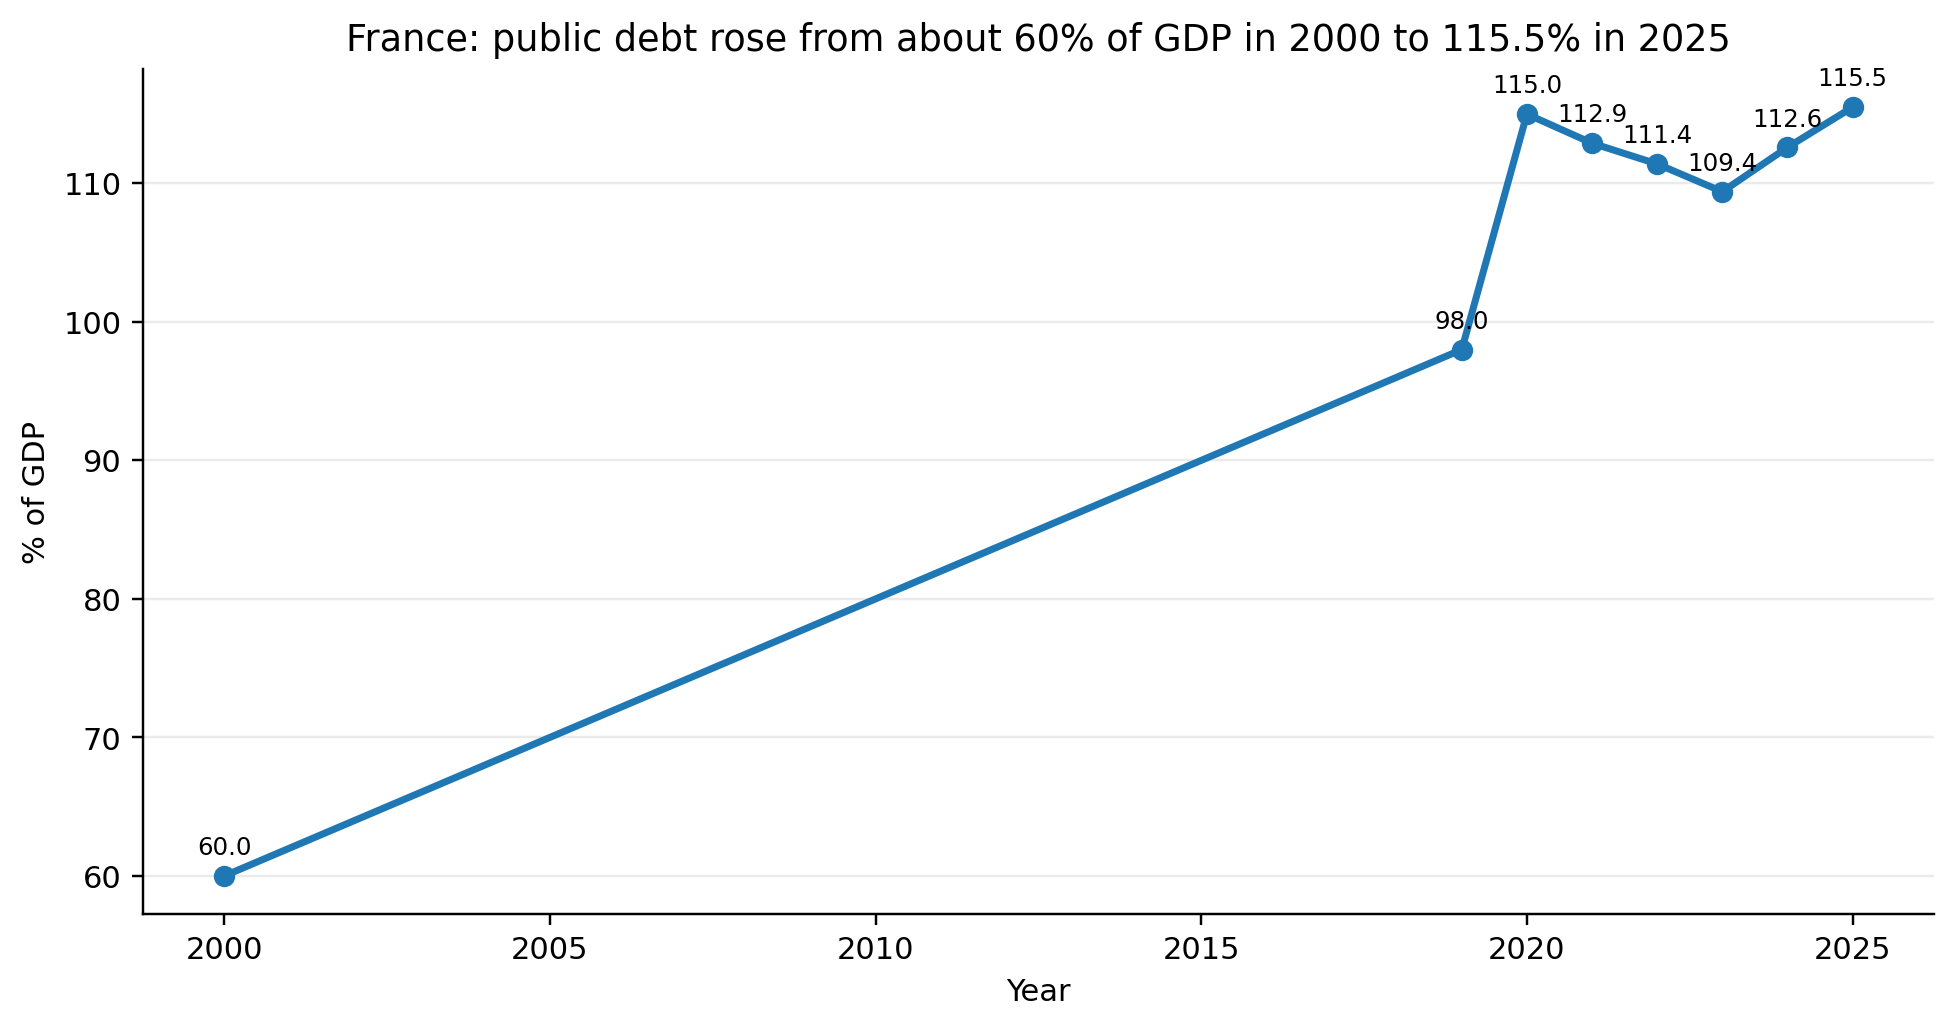
Figure RC2. Selected official debt-ratio observations from the OECD France 2026 survey. The 2000 point is the OECD’s long-run reference; 2019–25 are from its fiscal table. [RC1]
3. Root cause #2: crisis spending was not fully unwound
The 2008–09 crisis is the cleanest historical test. France and the euro area increased primary spending by similar magnitudes, but by 2019 France had reversed only about half of its increase, compared with roughly three-quarters in the euro area. French spending therefore remained 2.1 percentage points of GDP above its pre-crisis level, versus 0.9 point in the euro area. The OECD also warns that the apparent French spending reduction is overstated because conversion of the CICE tax credit into lower social contributions mechanically reduced measured spending by about 0.8 percentage point of GDP from 2019.[RC1]
The spending composition also makes adjustment difficult. Public spending was 57.2% of GDP in 2025, 7.4 percentage points above the euro-area average in the OECD comparison. Social protection explains about half of that gap; roughly 70% of the excess social-protection spending is old-age related. Health accounts for around 20% of the total spending gap. These are recurring commitments rather than one-off crisis programmes. [RC1]
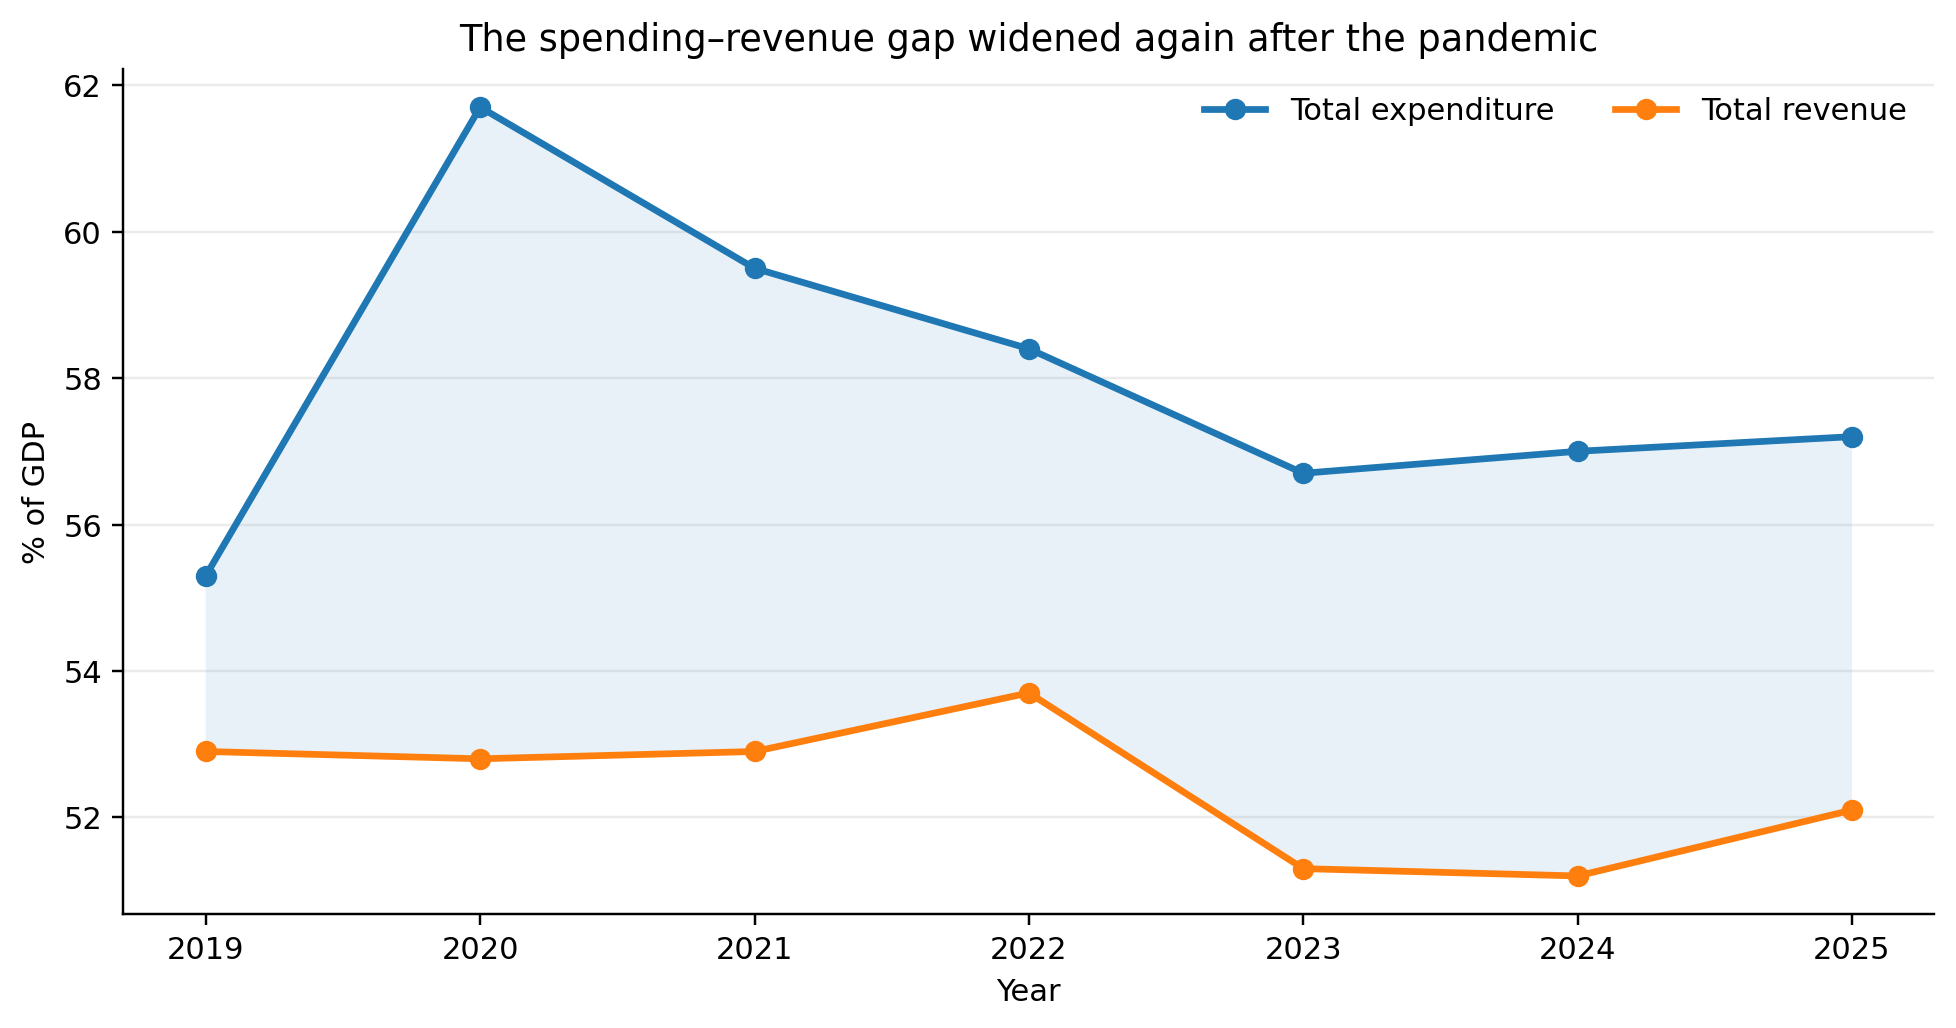
Figure RC3. Total general-government expenditure and revenue, % of GDP, OECD Economic Survey: France 2026. [RC1]
4. Root cause #3: tax reductions reduced revenue without an equivalent structural spending offset
Lower recurring tax revenue requires offsetting reductions in expenditure, alternative revenues or faster growth to hold the fiscal balance unchanged. The OECD finds that after the pandemic the loss of revenue from tax reforms outweighed structural spending reductions, while the Cour des comptes links the 2023–24 deterioration to tax relief without sustained core-expenditure savings. [RC1] [RC3]
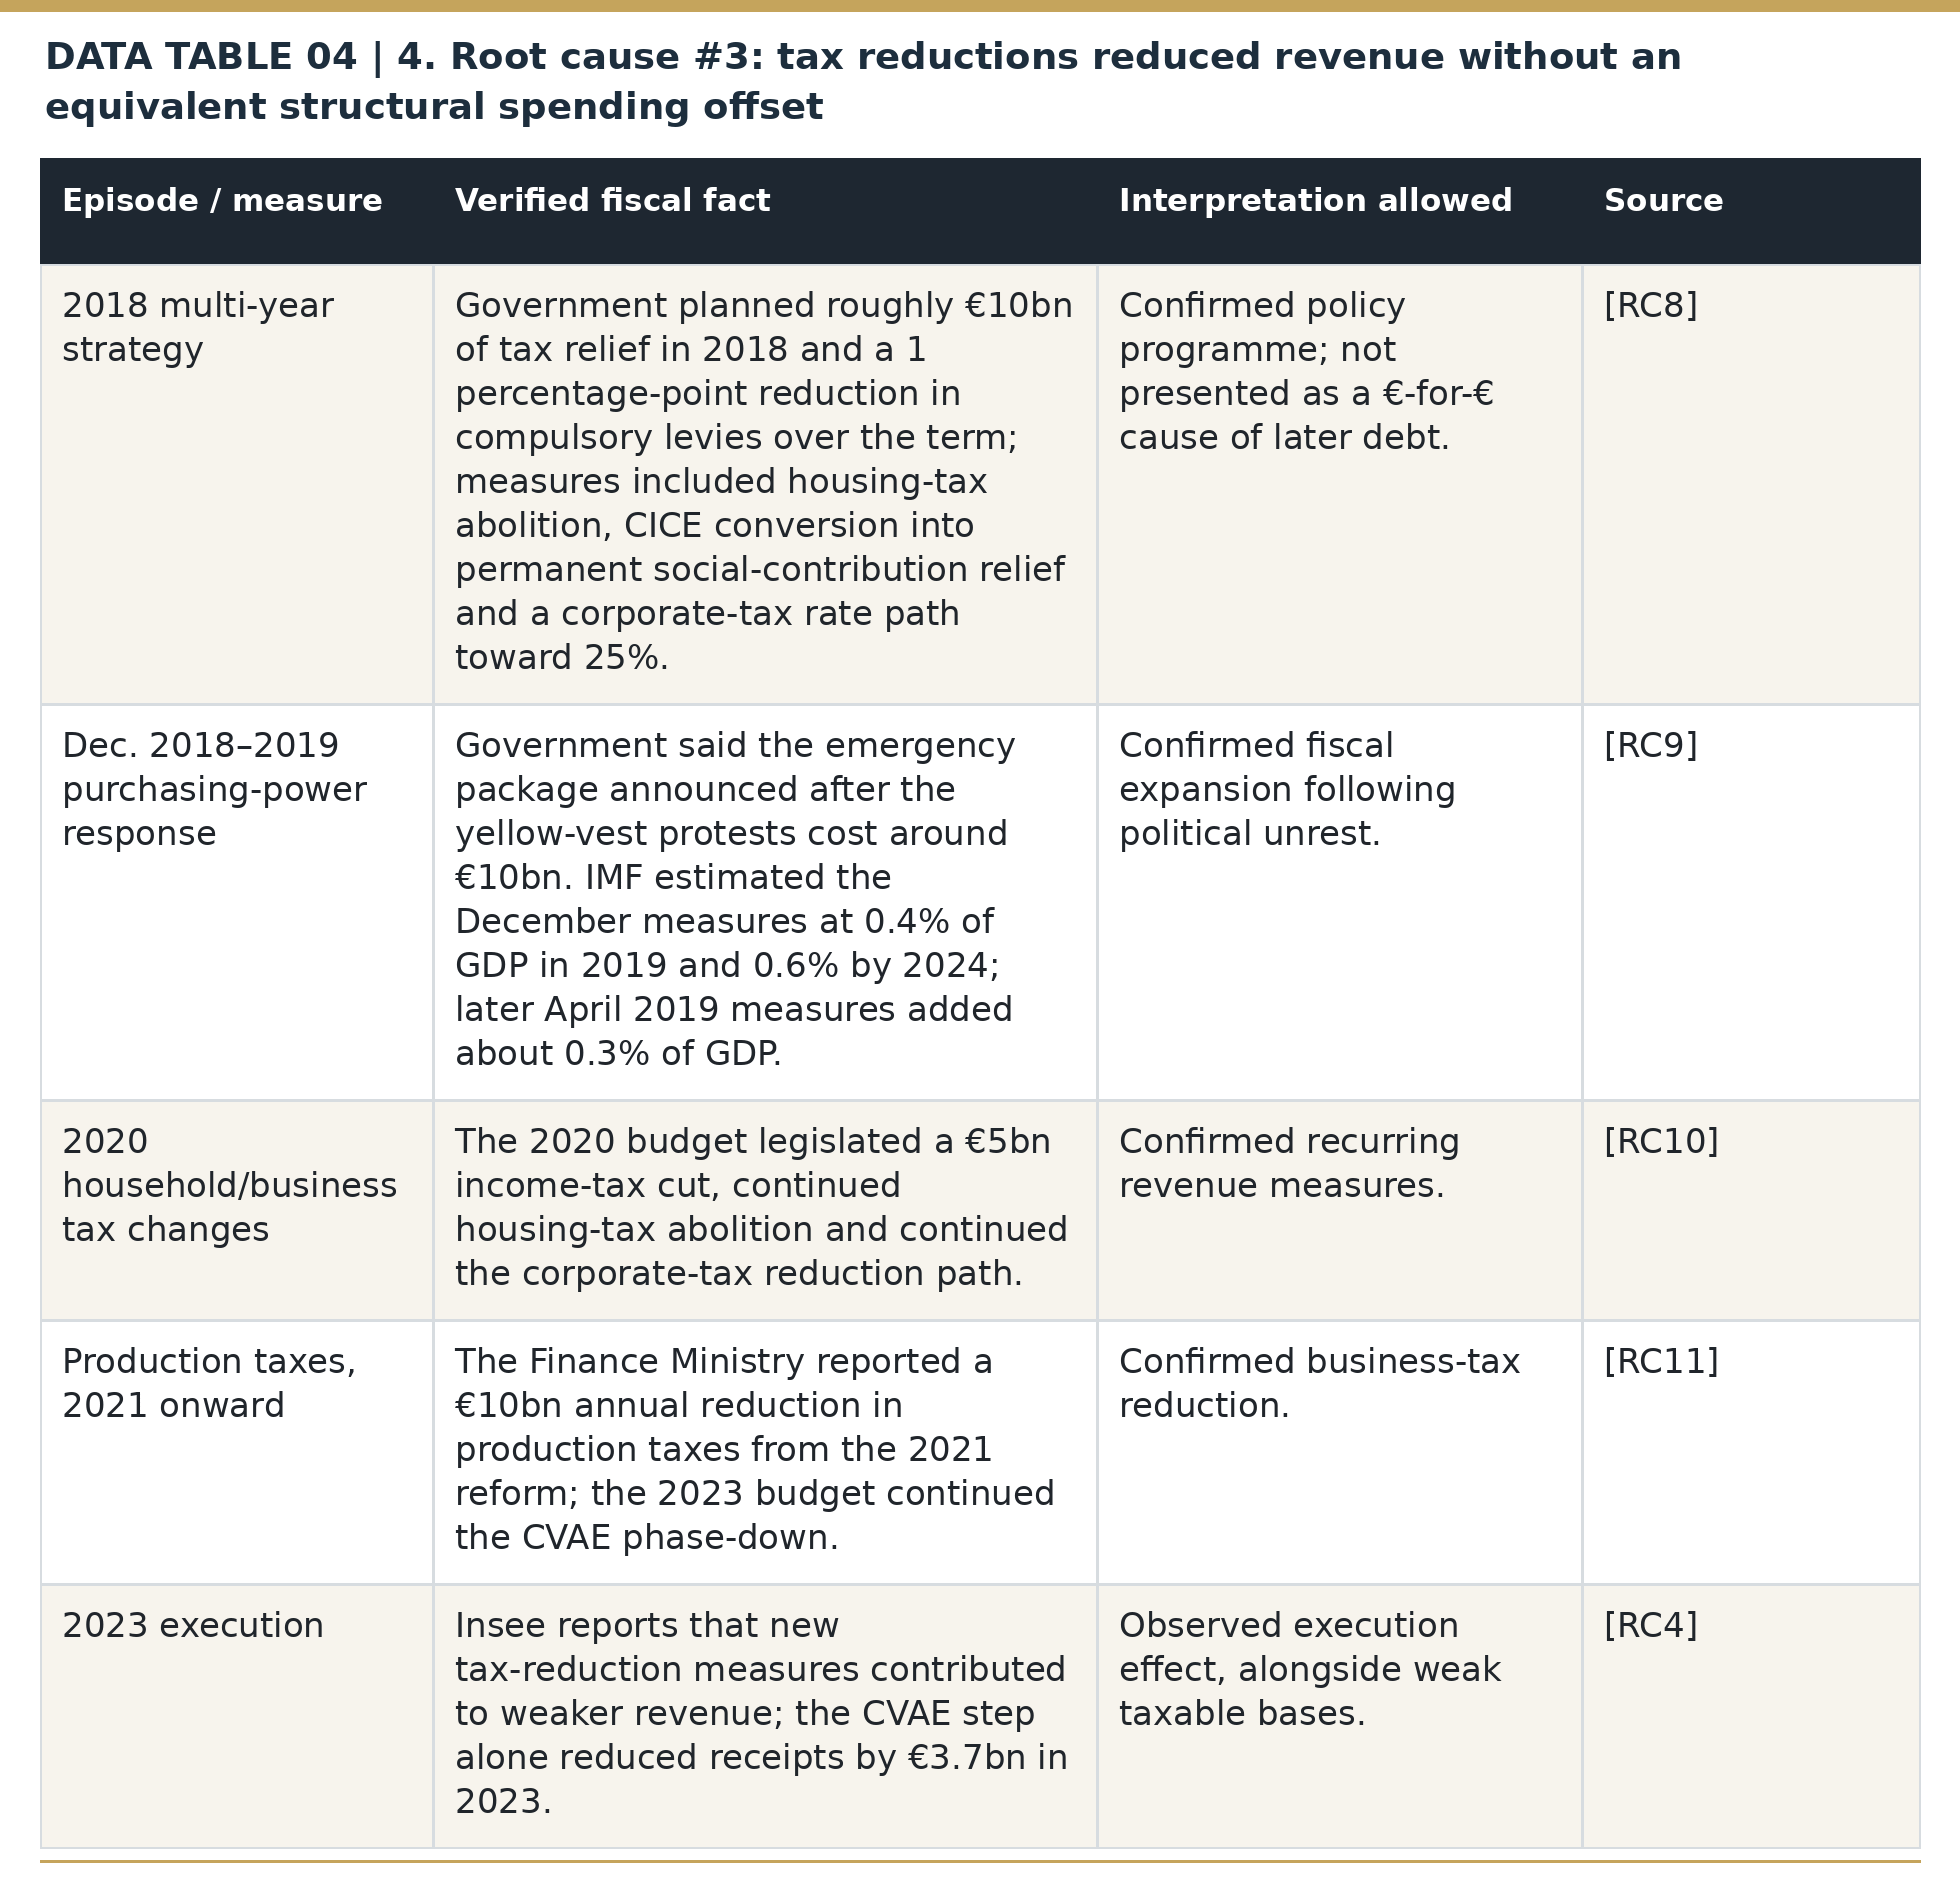
France was not a low-tax country during this period: the OECD reports a tax-to-GDP ratio of 43.5% in 2024, around 10 percentage points above the OECD average. That fact does not negate the revenue effect of individual tax cuts; it explains why the consolidation problem increasingly became one of expenditure control and tax-base efficiency rather than simply raising already-high broad tax ratios. [RC1] [RC21]
5. Debt ratchet #1: COVID permanently raised the starting debt stock
The pandemic was an exceptionally large but identifiable one-off shock. The Cour des comptes reports that real GDP fell 7.9% in 2020, general-government revenue losses reached €63.8bn, and expenditure rose €92.8bn as the state supported households and firms. The deficit reached about 9% of GDP and public debt rose by nearly 20 percentage points of GDP to roughly 115%. [RC6]
The key causal distinction is what happened afterward. Debt fell only partly as the economy reopened, and the primary balance remained deeply negative. In other words, COVID explains the large upward jump in the debt stock, but not why France later returned to deficits above 5% of GDP after emergency health measures were being withdrawn. [RC1] [RC4] [RC5]
6. Debt ratchet #2: the energy-price shock delayed normalization
France then chose broad support against the 2021–23 energy shock. The Cour des comptes estimates the state cost of measures adopted from autumn 2021 through the measures planned for 2024 at nearly €72bn, concentrated in 2022 (€24.1bn) and 2023 (€37.6bn). Separately, Insee reports net inflation-support measures of €29.8bn in 2022 and €25.1bn in 2023 in national-accounts terms. The exact totals differ because the accounting perimeter and offsetting energy-sector receipts differ; both sources confirm a large temporary fiscal intervention. [RC7] [RC4]
These programmes helped cushion activity and inflation; they also prolonged elevated expenditure and delayed deficit normalization. Deficits deteriorated in 2023 and 2024 even after support measures began to expire, underscoring the continuing underlying gap. [RC4] [RC5] [RC3]
7. The crucial test: 2023–24 deterioration persisted after the emergency phase
In 2023 the general-government deficit widened to 5.5% of GDP from 4.7%. Insee attributes the deterioration mainly to compulsory revenues growing much more slowly than nominal GDP; revenue rose only 2.0% while nominal GDP rose 6.2%. The compulsory-levy ratio fell to 43.5% from 45.2%. Spending also remained above its 2019 share of GDP, and local-government finances deteriorated. [RC4]
The 2024 result is even more important for root-cause identification. The deficit widened again to 5.8% of GDP. Insee describes a “scissors effect”: compulsory revenues grew more slowly than nominal activity while social benefits accelerated 5.5%, partly reflecting indexation to 2023 inflation. The Cour des comptes concludes that the increase in core public spending—excluding debt service and exceptional crisis measures—was the main factor behind the 2024 deficit deterioration, alongside overly favourable growth/revenue assumptions and local-government spending overruns. [RC5] [RC3]
Official targets repeatedly proved too optimistic. The 2023 programming law had projected a 4.9% deficit, compared with a revised actual 5.4%; the April 2024 programme expected 5.1% for 2024, but the deficit reached 5.8%. The October 2024 medium-term plan projected 5.0% for 2025 before the target was revised. [RC3]
8. Root cause #4 for the current risk premium: the correction mechanism became politically unreliable
Fiscal policy became harder to enact after President Macron’s June 2024 dissolution left the National Assembly without a stable governing majority. The fall of successive administrations in December 2024 and September 2025 over adjustment packages provides direct evidence of the implementation difficulty. [RC13] [RC14]
In December 2024 Michel Barnier’s government fell after opposition parties rejected a budget built around roughly €60bn of tax increases and spending cuts. S&P said the government’s fall left France without a clear path to deficit reduction and that it expected materially less consolidation than the package had implied. [RC13]
In September 2025 François Bayrou’s government lost a confidence vote by 364 votes to 194 after proposing about €44bn of 2026 savings. Four days later Fitch downgraded France to A+, citing rising debt and political instability and a lack of clarity on debt stabilization. These dated events provide direct evidence that the political system was constraining the implementation of fiscal adjustment. [RC14] [RC15]
France’s 2026 budget initially aimed for a 4.7% deficit, but legislative concessions produced a final 5.0% target with higher revenues and around €9bn of spending cuts. The weakening of the target during negotiations illustrates how parliamentary arithmetic constrained fiscal plans. [RC16]
9. Why the adjustment requirement kept getting larger
By 2025, France had begun a material consolidation, but it was not enough to stabilize debt. OECD estimates show the deficit falling by 0.7 percentage point to 5.1% of GDP while debt still rose to 115.5%. The OECD says the 2025 adjustment relied mostly on revenue and that a cumulative adjustment of around 3% of GDP by 2030 would be needed to stabilize debt under its baseline. [RC1]
Government ceilings published in July 2026 projected debt-interest expenses rising to €74.2bn in 2027, from €64.8bn in 2026, while defense and social-security appropriations were also rising. The OECD identifies ageing, climate investment and defense as additional medium-term claims on public finances. [RC17] [RC1]
In September 2026 the government warned that the 2027 deficit could exceed 6.5% of GDP without corrective measures and proposed an approximately €54bn budget effort to target 5%. [RC19]
10. Higher market yields and issuance amplify fiscal pressure
Rising market rates turn the accumulated debt stock into a larger annual cash cost. Agence France Trésor’s 2027 budget financing table puts the State financing requirement at €339.7bn, medium- and long-term net issuance at €340bn and State debt service at €72.9bn. For 2026, AFT reported a weighted average yield of 3.55% on medium- and long-term issuance, versus 3.14% in 2025. [RC18]
A larger stock of outstanding debt requires progressively more refinancing. When market yields rise, the interest bill on maturing debt increases as old bonds are replaced by more expensive issues; the larger bill in turn raises the size of the budget adjustment required. [RC18] [RC22]
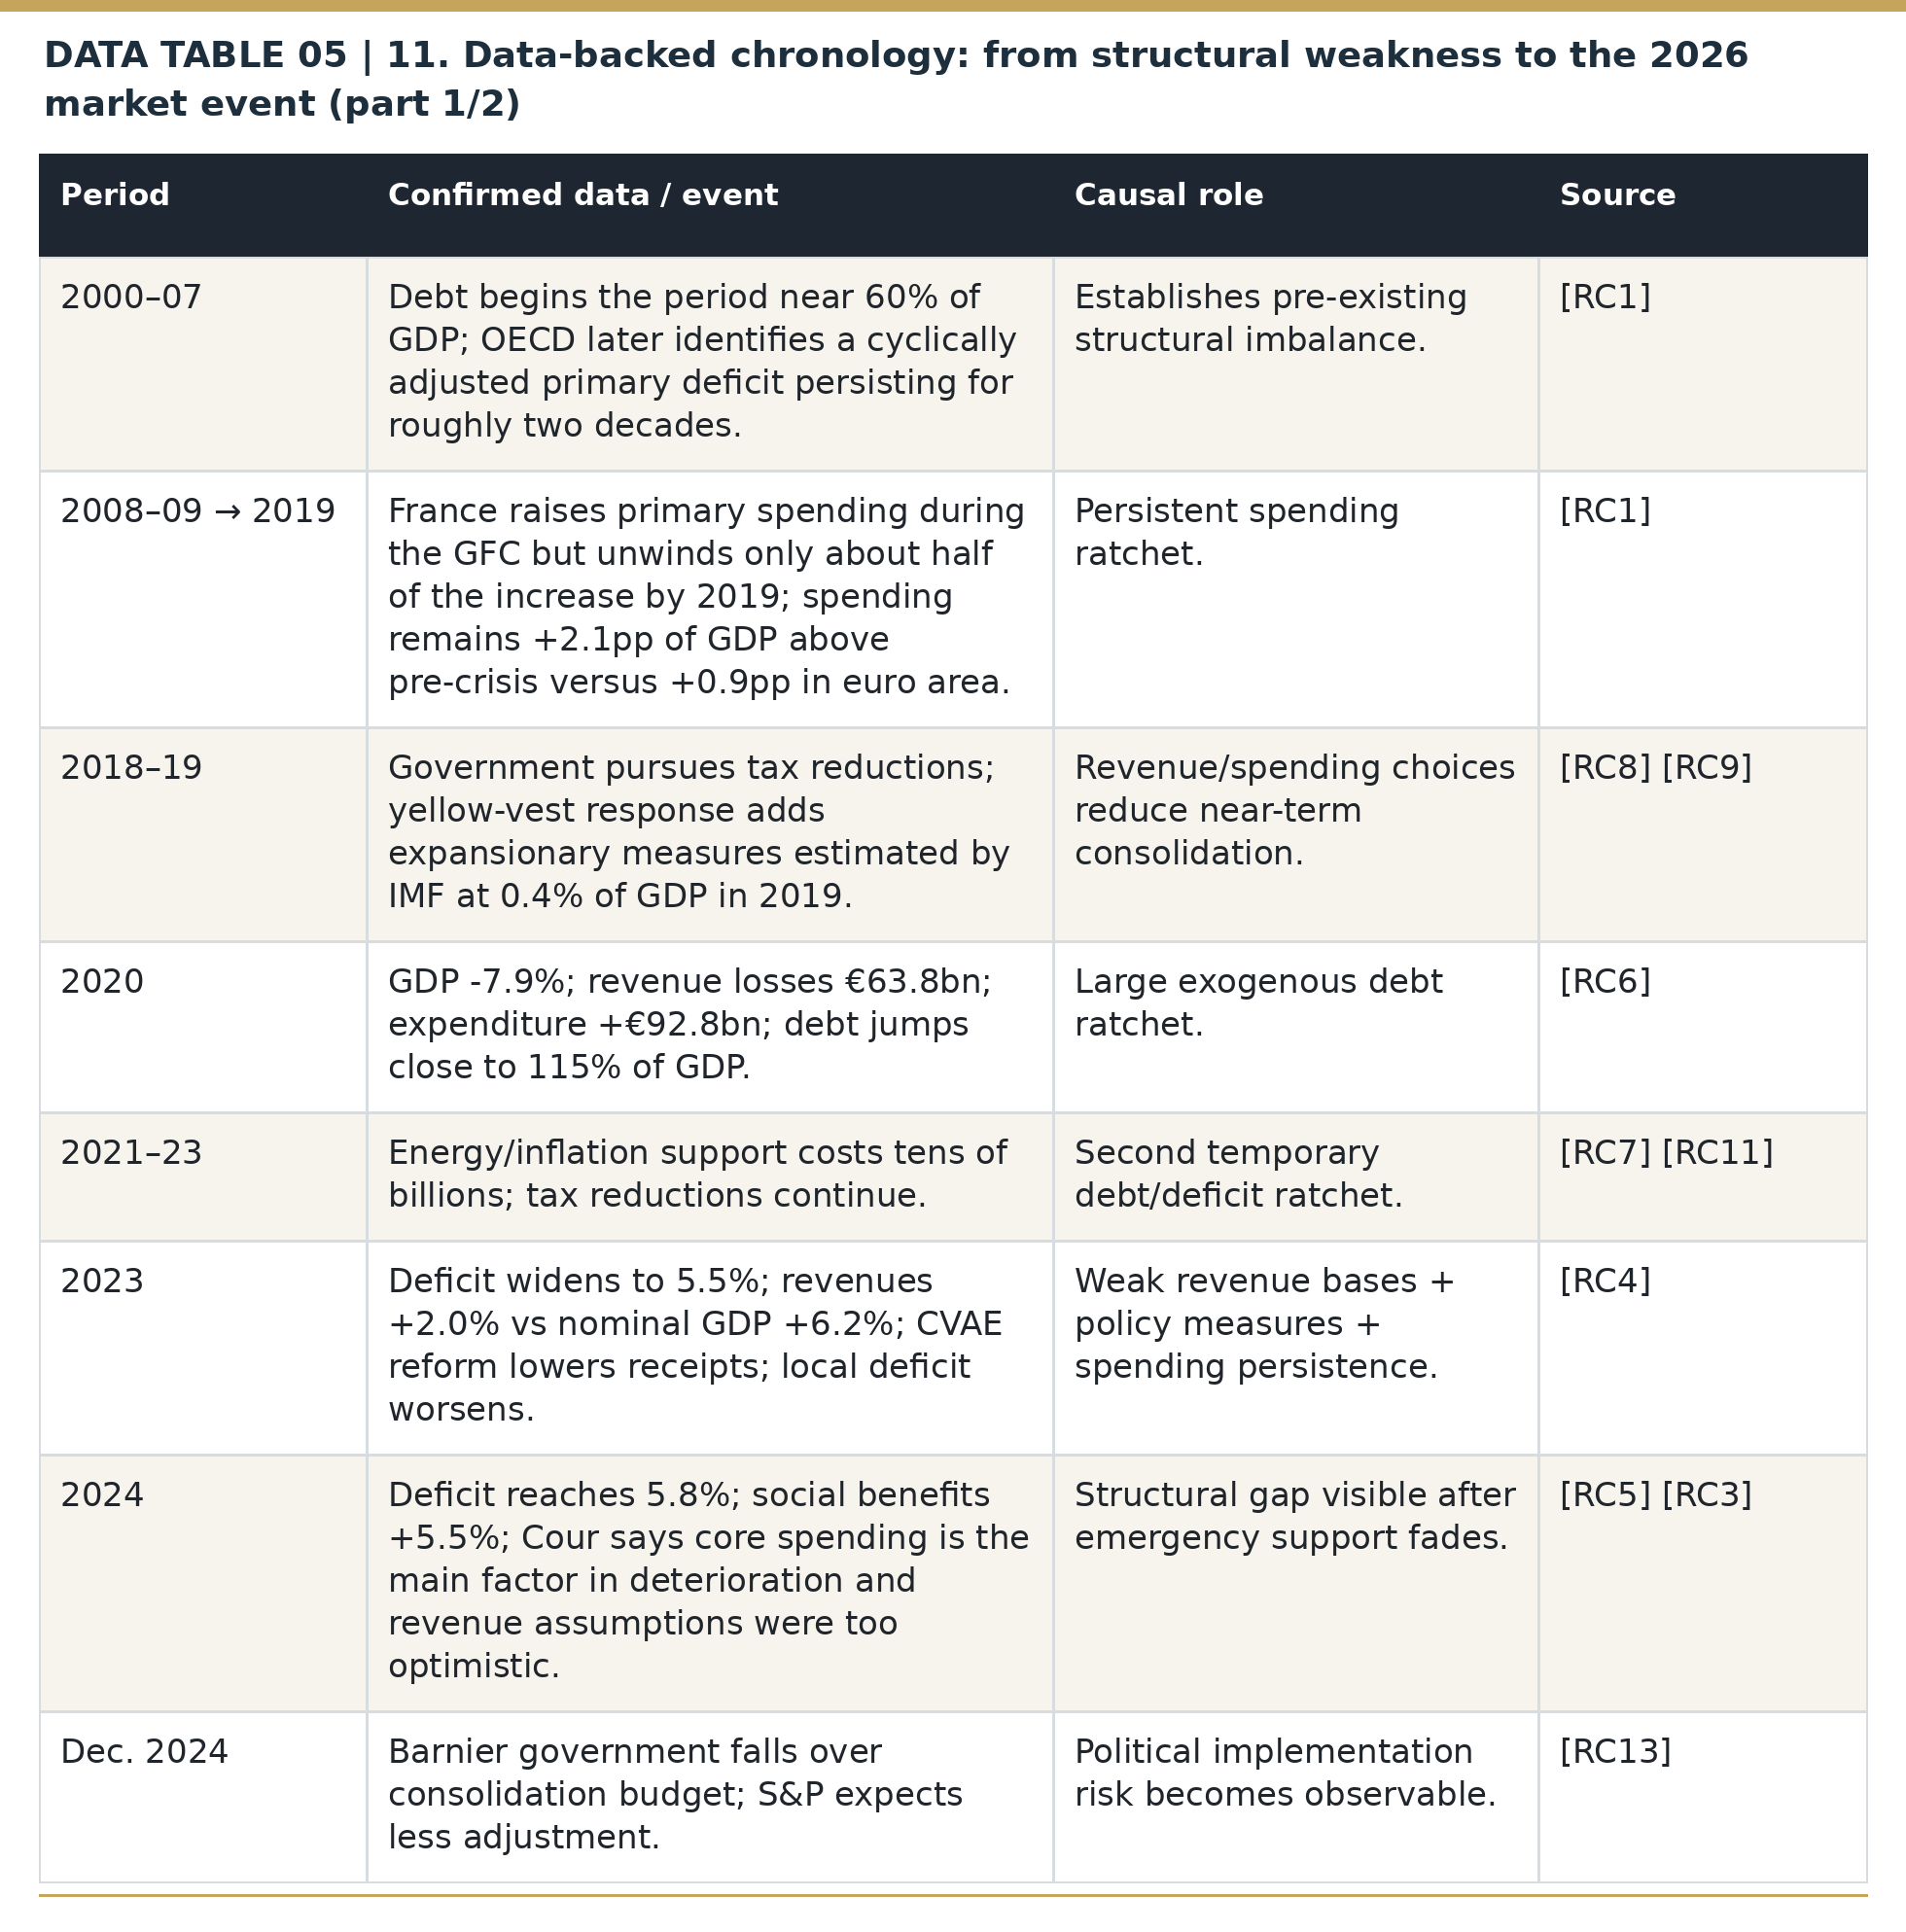
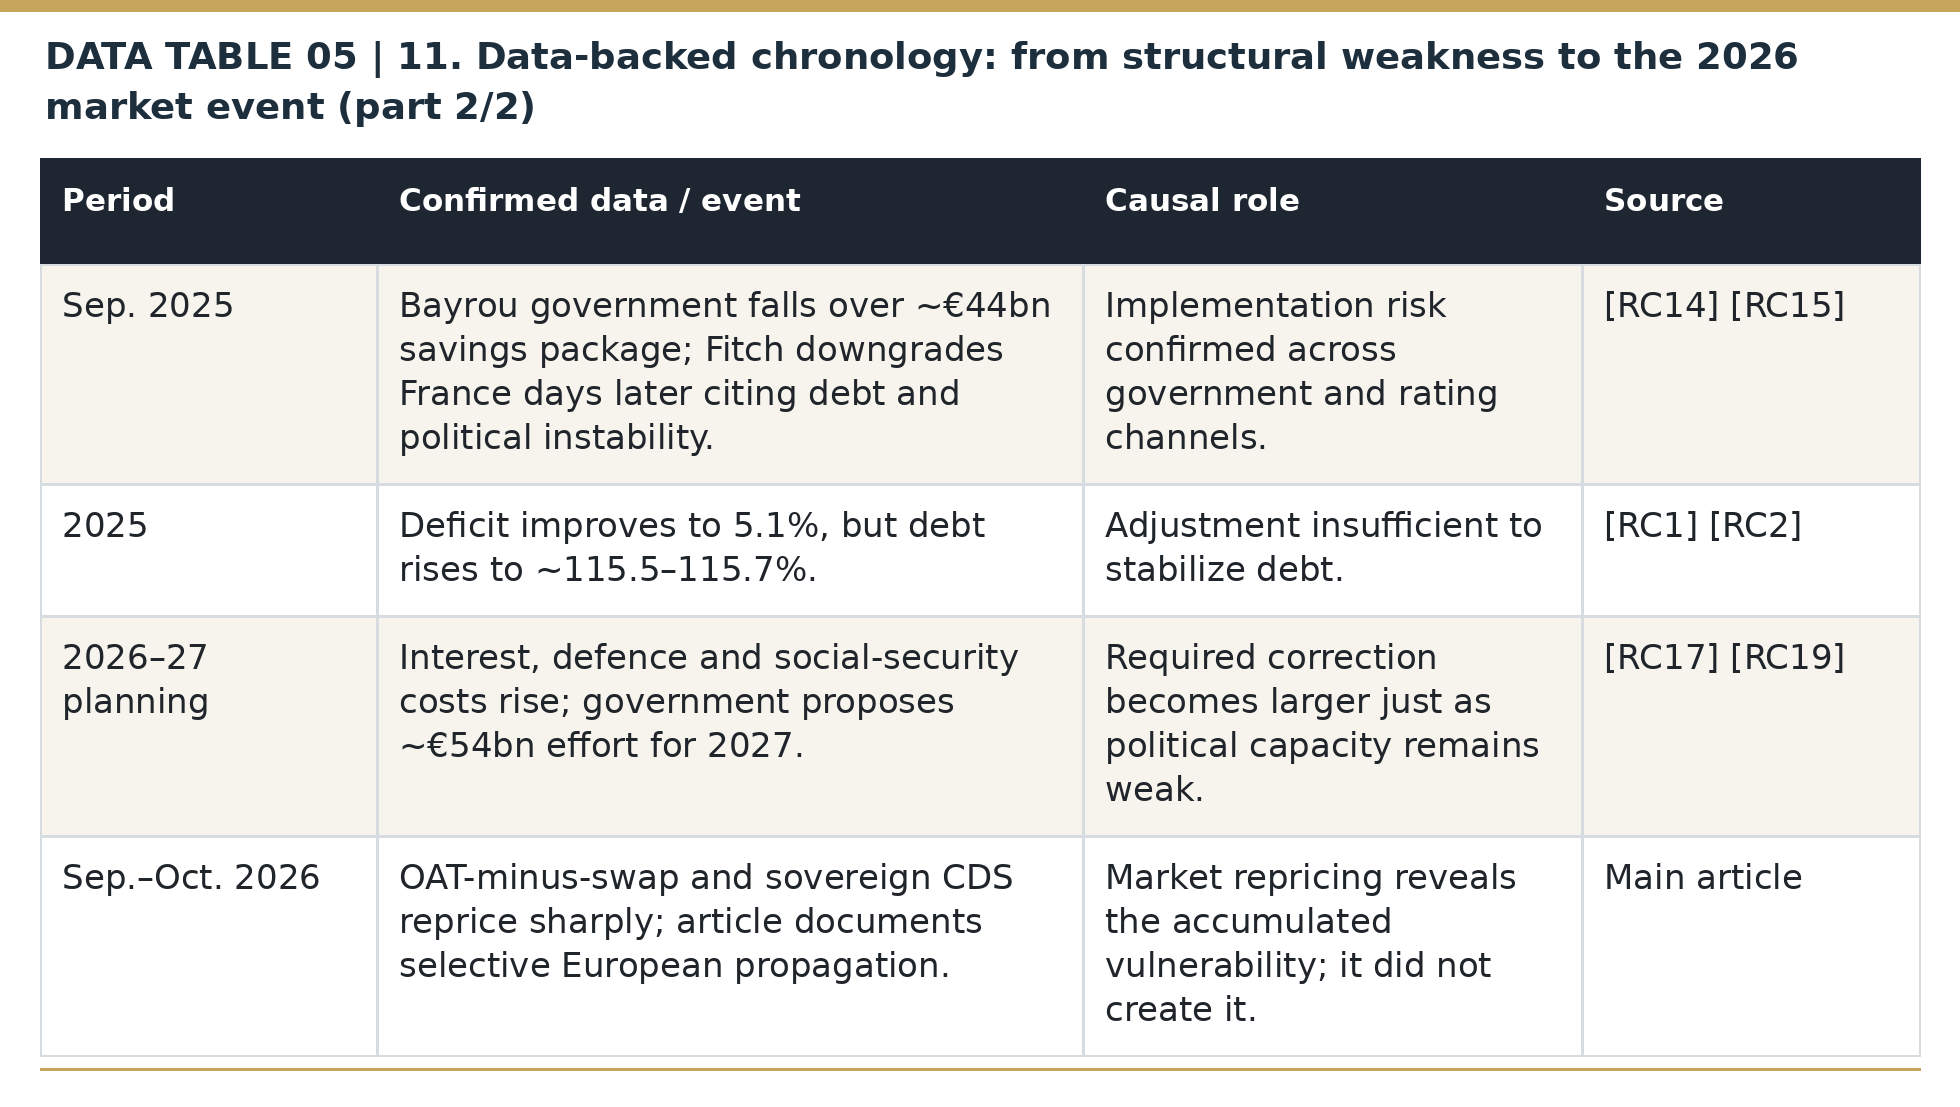
11. Data-backed chronology: from structural weakness to the 2026 market event
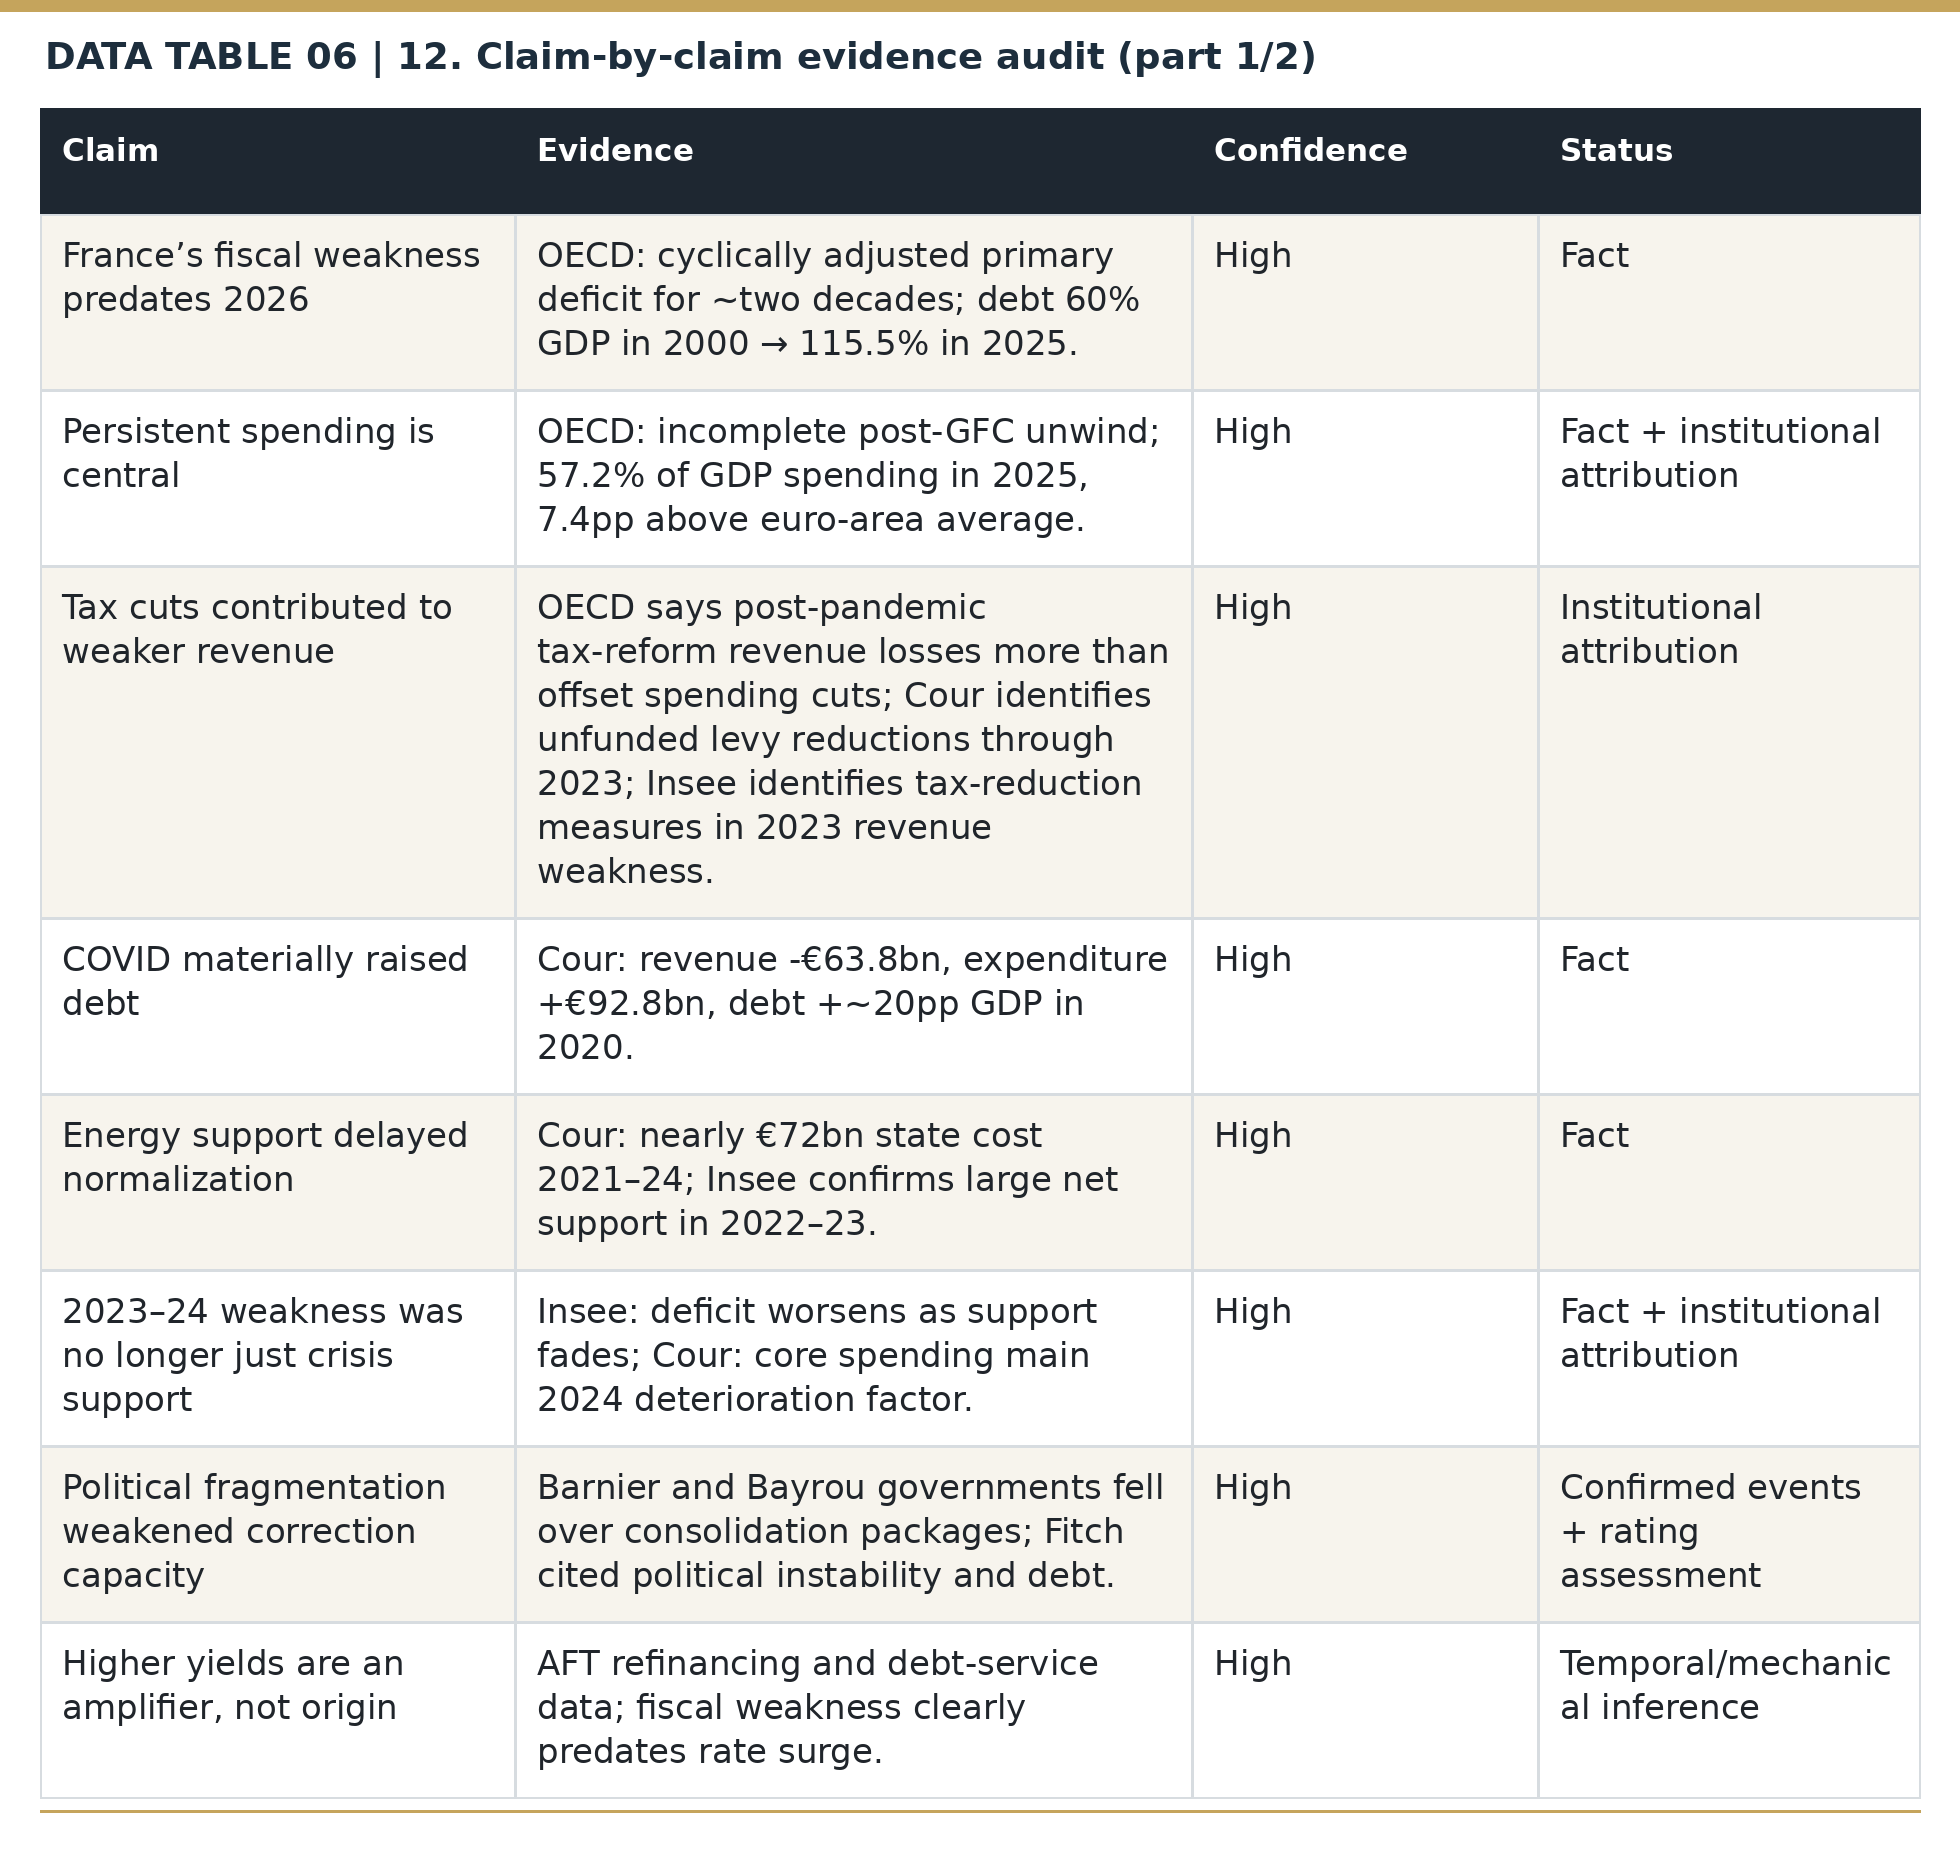
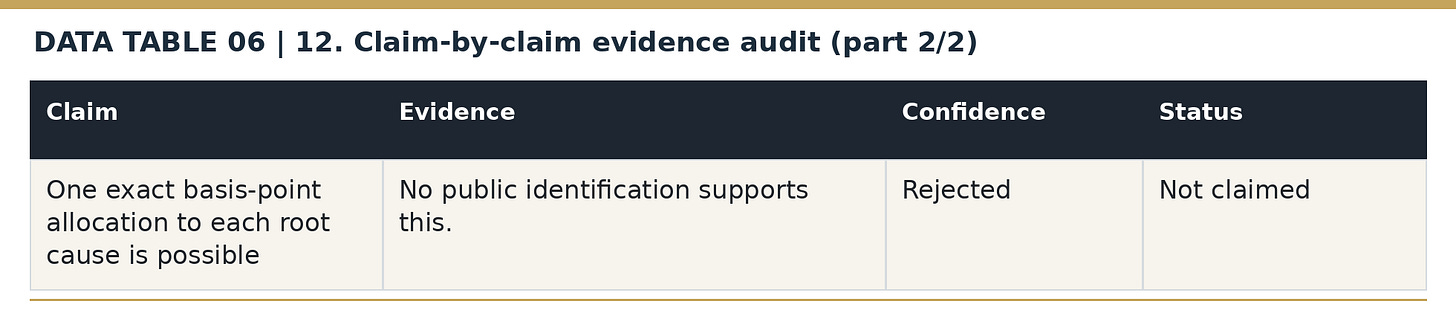
12. Claim-by-claim evidence audit
13. Root-cause conclusion
France’s debt vulnerability accumulated through recurring primary deficits, high spending commitments, incomplete unwinding of crisis support and reductions in recurring revenues that were not fully offset. The deficit widened again in 2023–24 after emergency measures faded, pointing to a durable mismatch between fiscal commitments and revenues. [RC1] [RC3] [RC4] [RC5] [RC6] [RC7]
Repeated budget confrontations in 2024–26 then made fiscal repair less credible. Investors had to judge whether successive governments could implement a multi-year adjustment, at a time when the cost of refinancing was rising. [RC13] [RC14] [RC15] [RC16] [RC19]
Moody’s October 23 decision to retain Aa3 with a negative outlook and the National Assembly’s rejection of the 2027 social-security financing bill both reinforce the importance of implementation risk. [62] [63]
The fiscal history establishes the underlying vulnerability; the following sections trace how it appeared in sovereign bonds, banks and euro exchange rates.
Why French borrowing costs rose: the spread level and its change
Observation windows end on Friday, October 23, the last trading session before the October 24–25 weekend. September 24 provides a one-month comparison; October 7 is used separately to isolate the late-October acceleration. Both dates are defined within this article, independently of the publication date.
At the October 23 close, the 10-year French government yield was 5.028%, the German yield was 3.3434%, and the 10-year euro interest-rate swap rate was 3.460%. France therefore yielded 156.80bp more than the swap benchmark and Germany yielded 11.66bp less. The French–German gap was 168.46bp. This identity shows how the observed yield difference is distributed around the same reference rate; credit and fiscal causes are analyzed through separate evidence. The gap widened 29.61bp between October 7 and October 23 and 59.40bp between September 24 and October 23. [3] [4] [5]
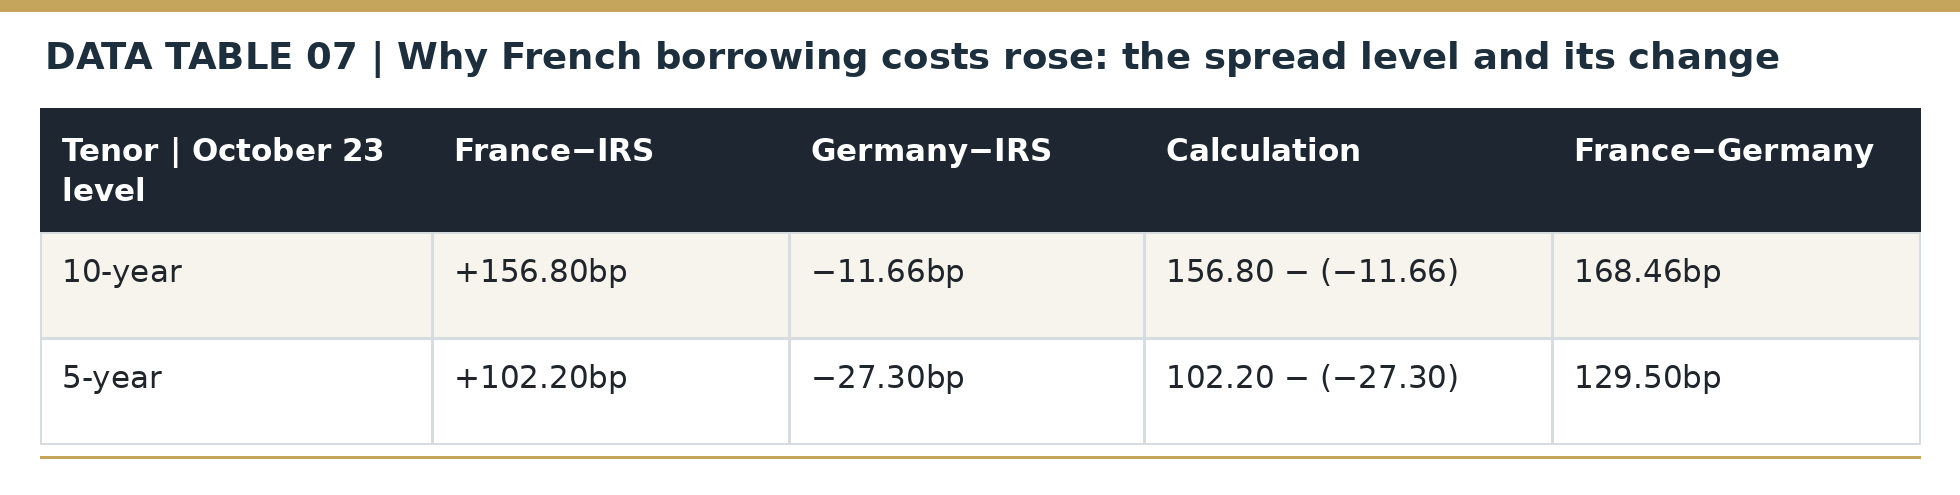
French and German yields influence their bilateral gap independently: a rise in French yields widens it, as does a fall in German yields. Subtracting the same five- or ten-year euro swap rate from both sovereign yields identifies the contribution of each leg to the change.

The comparisons use five- and ten-year bonds and swaps of corresponding maturities. All observations come from publicly displayed daily closing prices; minor differences between trading-market closing times can affect the exact split. [3] [4] [5] [6] [7] [8]
For September 24–October 23, the 10-year French-minus-swap premium increased 53.90bp and the German leg contributed 5.50bp to the bilateral widening of 59.40bp. For October 7–23, the respective figures were 29.00bp and 0.61bp, giving 29.61bp in total. The five-year French shares were 93.9% and 97.8%. These percentages measure yield movements relative to swaps. [3] [4] [5] [6] [7] [8]
Using daily closes from the same source, the French–German 10-year gap rose from 138.85bp on October 7 to 168.46bp on October 23. Independent curve-construction conventions place the latter close between about 168bp and 172bp; those sources provide useful corroboration of the level. [3] [4] [46] [52] [53]
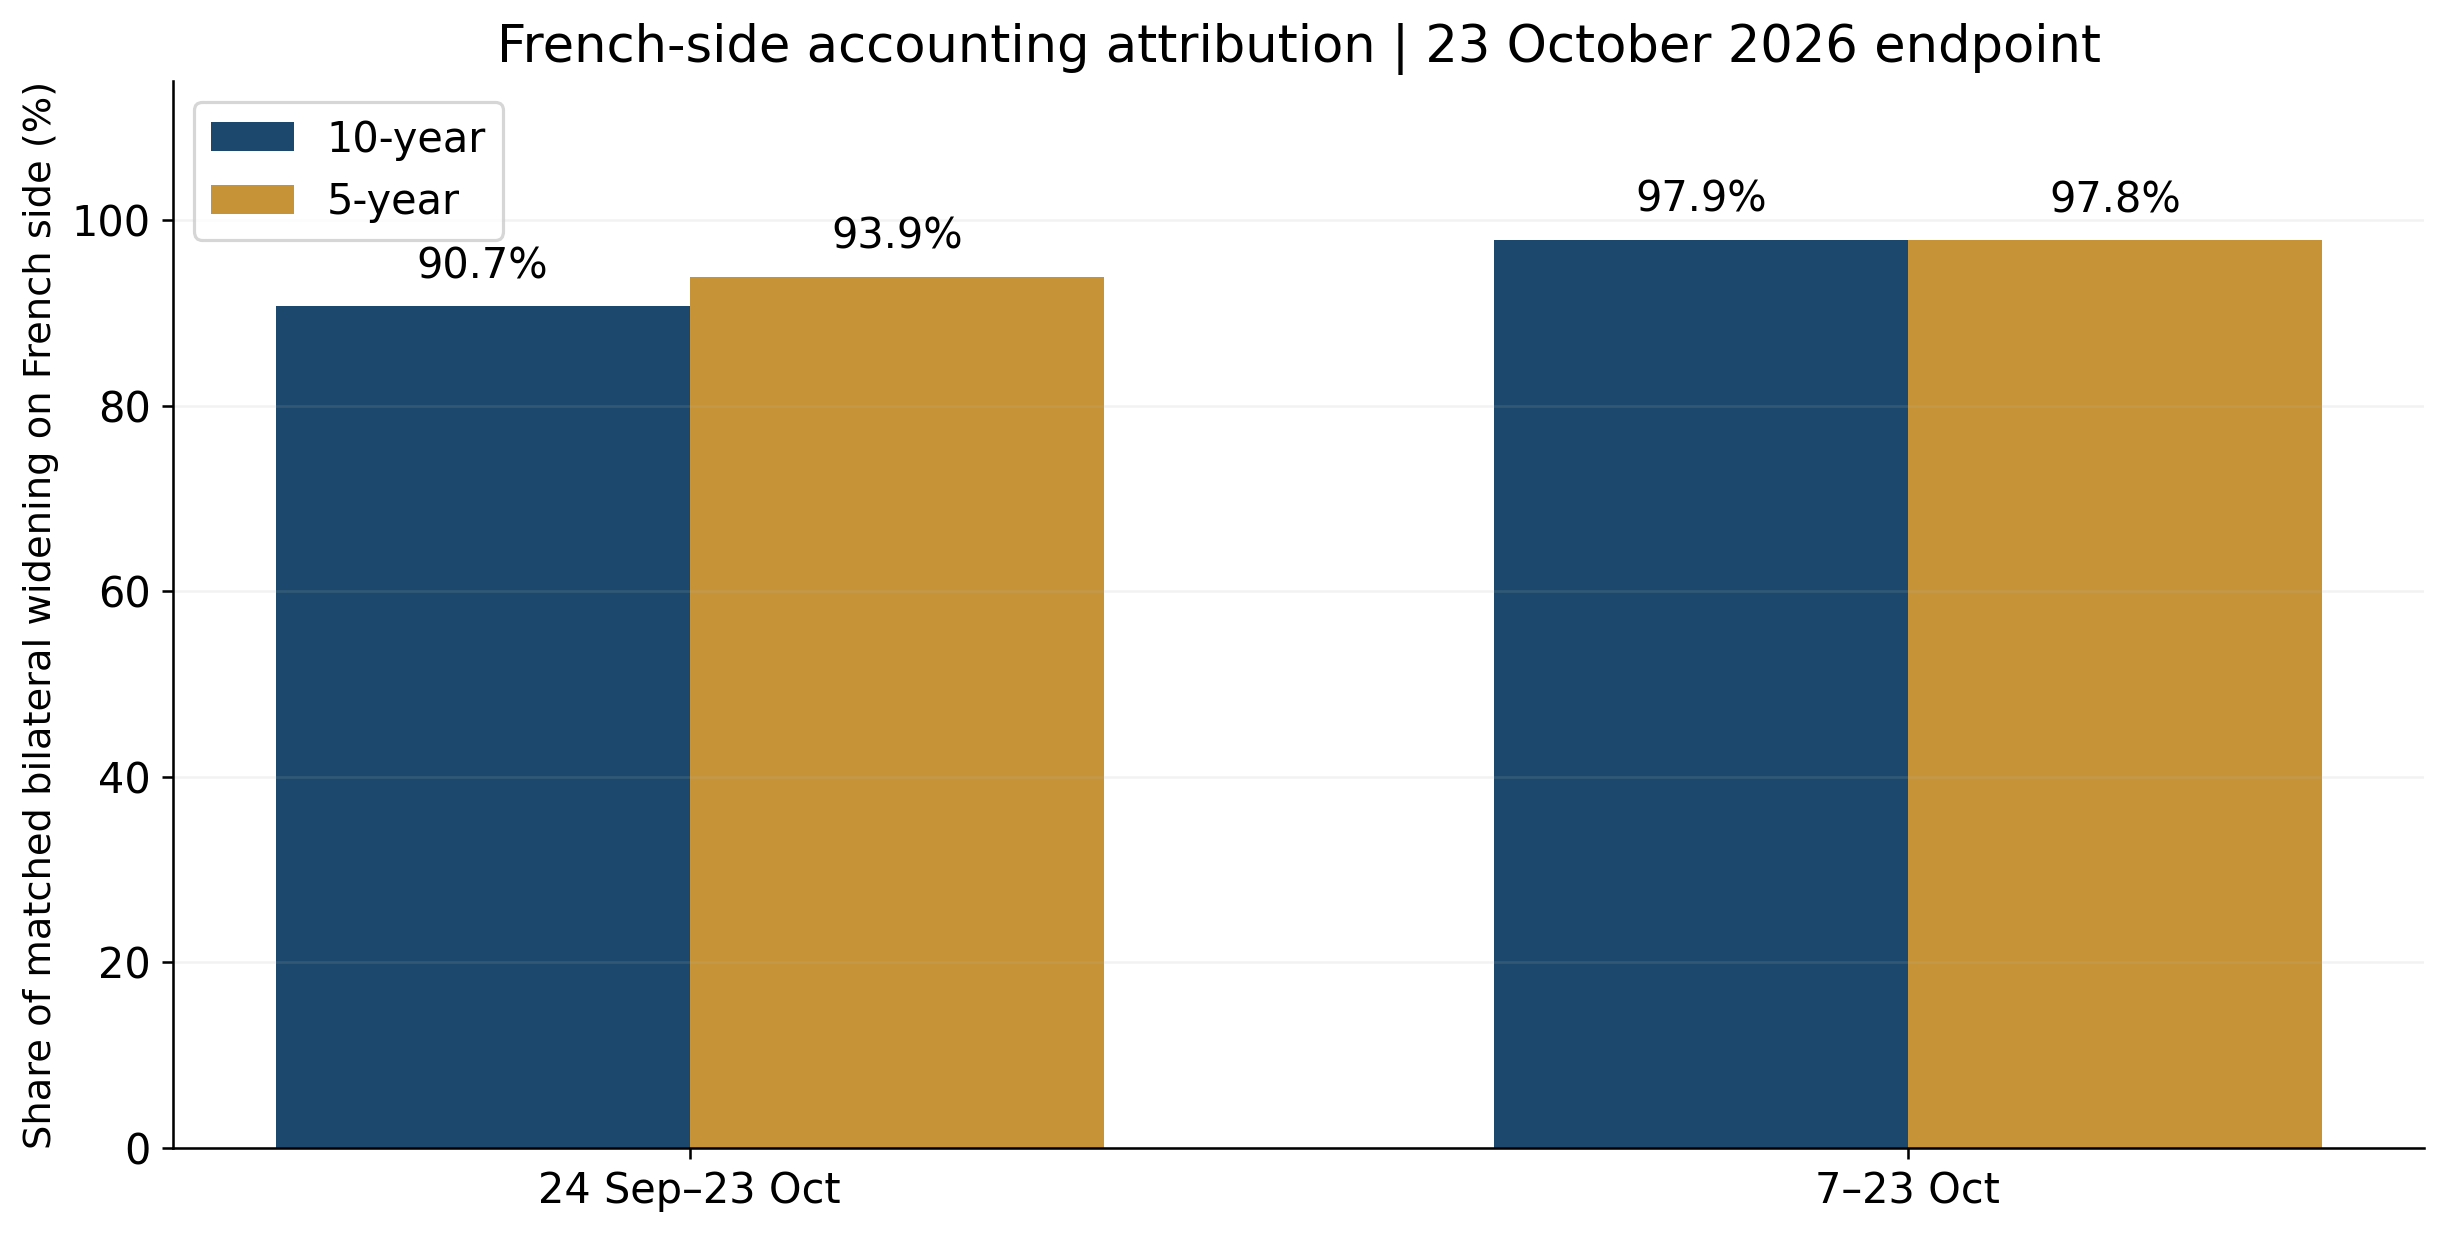
Figure 1. French share of the five- and ten-year OAT–Bund widening: September 24–October 23 and October 7–23, 2026.
Source: SharpeEdge calculations from daily French and German government yields and corresponding euro interest-rate swaps; latest close October 23, 2026. [3] [4] [5] [6] [7] [8]
French five-year sovereign CDS premiums reached 96.23bp on October 22, compared with 77.36bp on October 7 and approximately 34.5bp in early September. This +18.87bp increase after October 7 outpaced Italy (+7.74bp) and Spain (+4.30bp). Rising insurance premiums suggest that French credit-risk compensation was rising alongside bond yields. [10] [35] [44]
What the latest French yield and CDS repricing reveals
Between October 7 and October 23, France’s five-year yield increased from 4.180% to 4.437%, while the euro five-year swap rate fell from 3.468% to 3.415%. As a result, France’s yield premium over swaps widened 31.0bp. French sovereign CDS widened 18.87bp over the nearly corresponding period, compared with 7.74bp for Italy. Together, these securities show a France-led credit repricing. [6] [8] [10] [35]
Large inherited financing needs, politically difficult 2027 consolidation and global-duration pressure provide plausible mechanisms behind the rise in required yields. Public bonds and CDS establish the direction and cross-country pattern; they do not assign exact basis-point contributions among taxes, spending, politics, supply or trading liquidity. [10] [55] [56]
How France’s repricing spread across other European government bonds
Between October 7 and October 23, five-year government yields relative to swaps widened by 31.0bp in France, 7.9bp in Italy, 2.0bp in Spain and 4.2bp in Austria; the Netherlands richened by 0.4bp relative to the common swap. Ten-year sovereign premiums relative to Germany increased about 29bp for France, 9bp for Italy, 6bp for Spain and 4bp for Austria, whereas the Netherlands fell roughly 1bp. These observations show a stronger France-specific acceleration during this later period. [6] [8] [9] [45] [49] [50] [51]
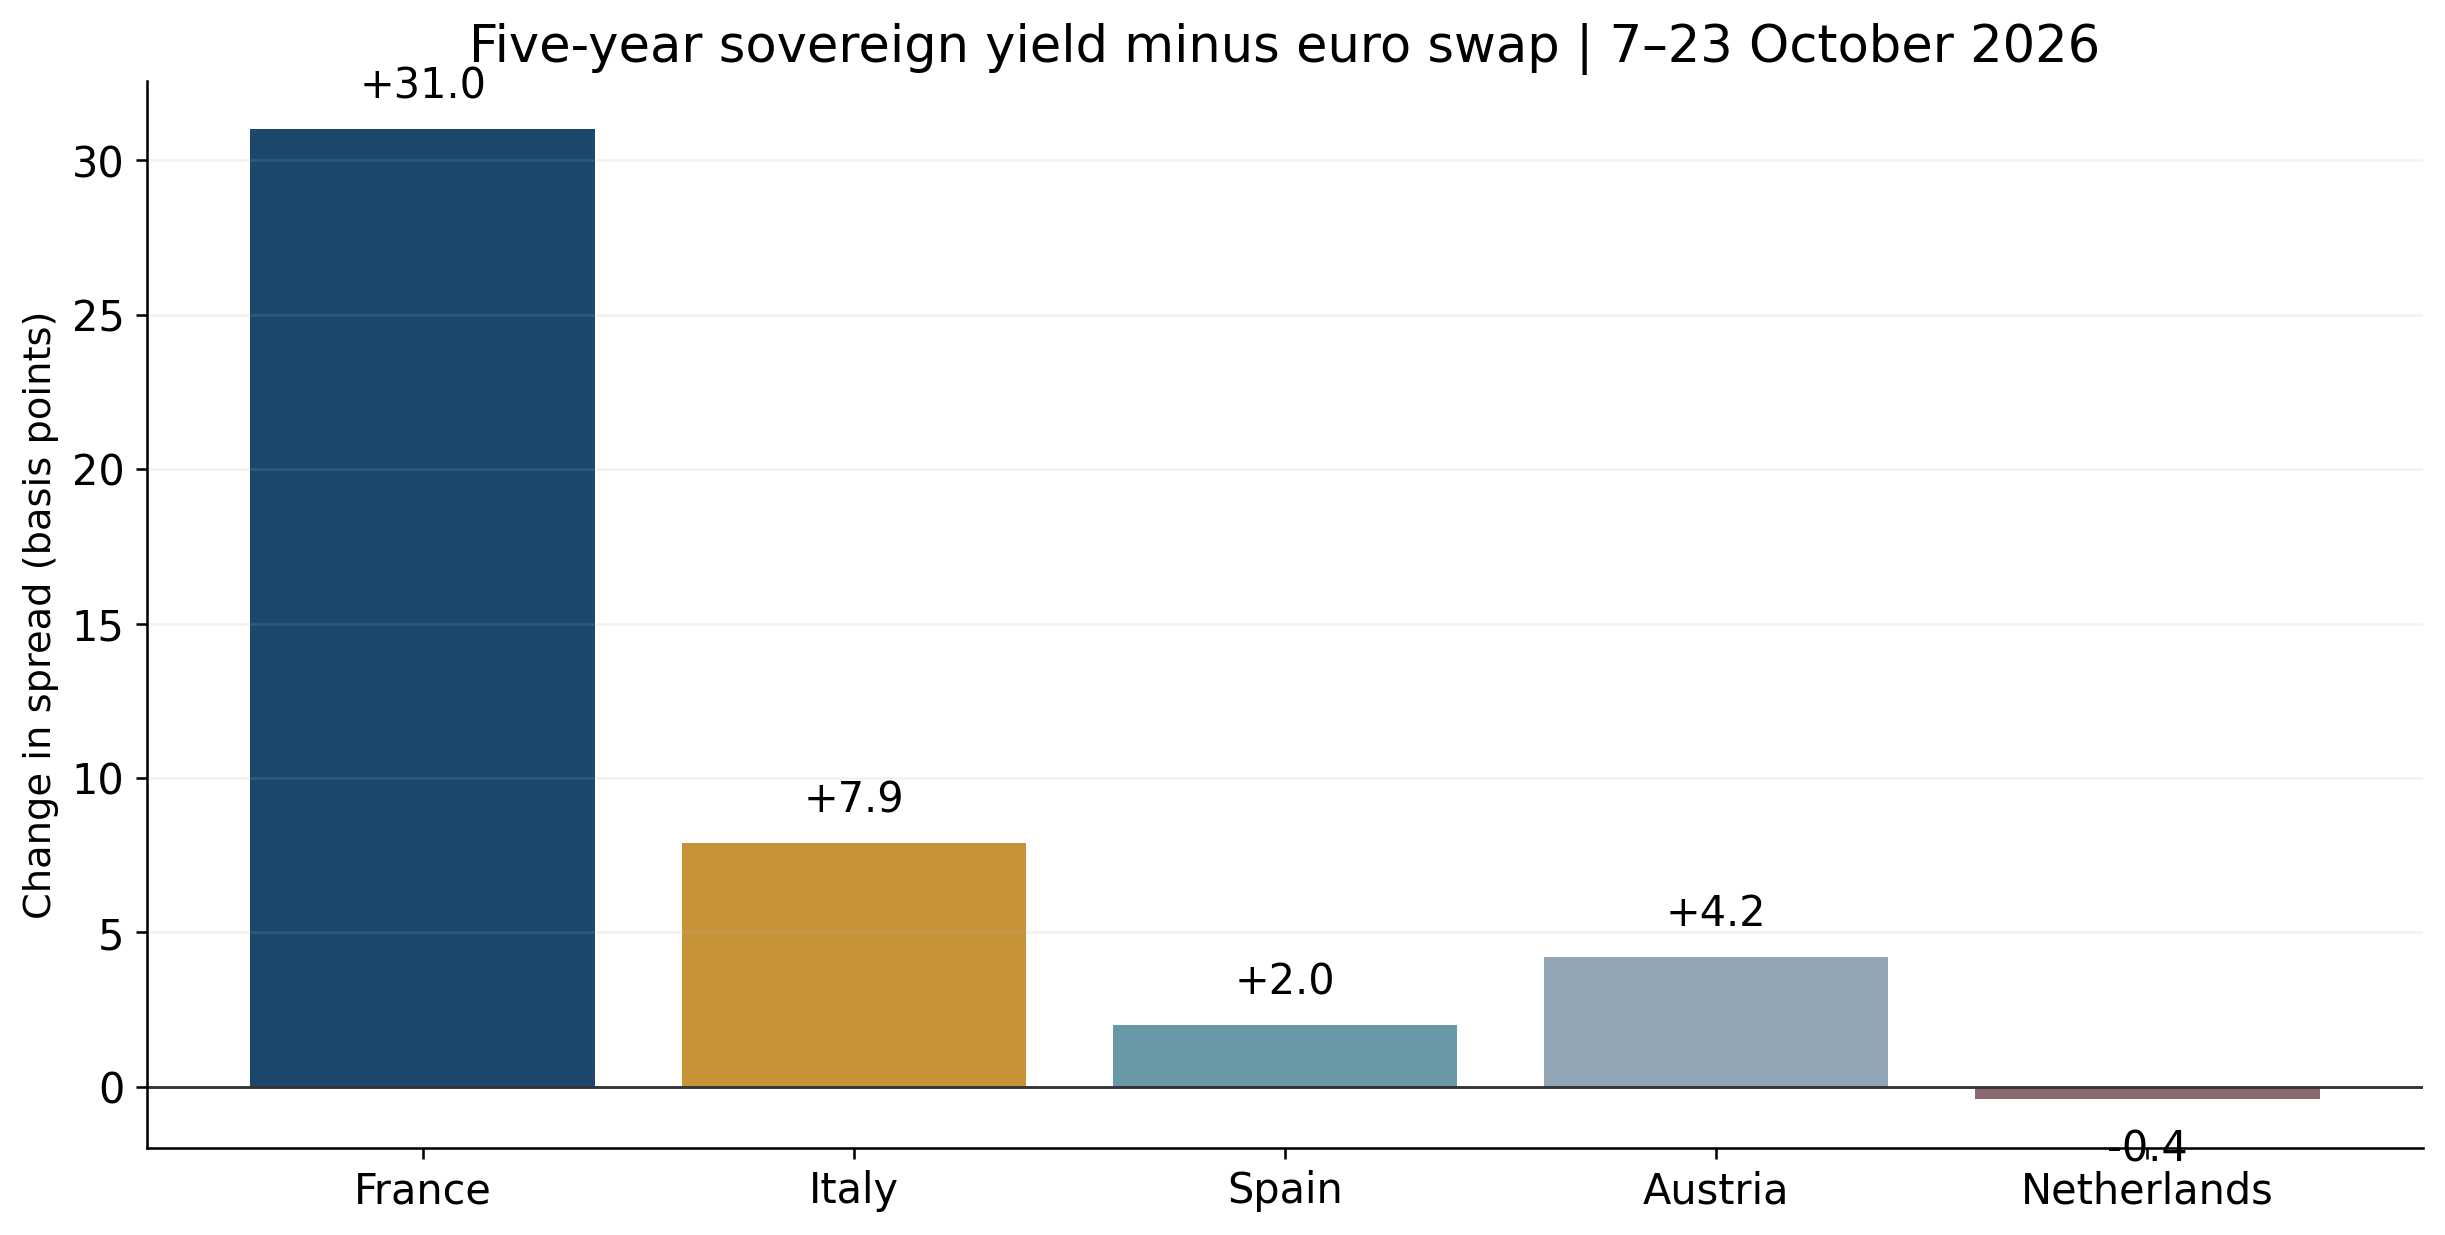
Figure 2. Sovereign yield changes versus euro interest-rate swaps, October 7–23, 2026 (basis points).
Source: SharpeEdge calculations from five-year government yields for France, Italy, Spain, Austria and the Netherlands and the common five-year euro interest-rate swap. [6] [8] [9] [49] [50] [51]
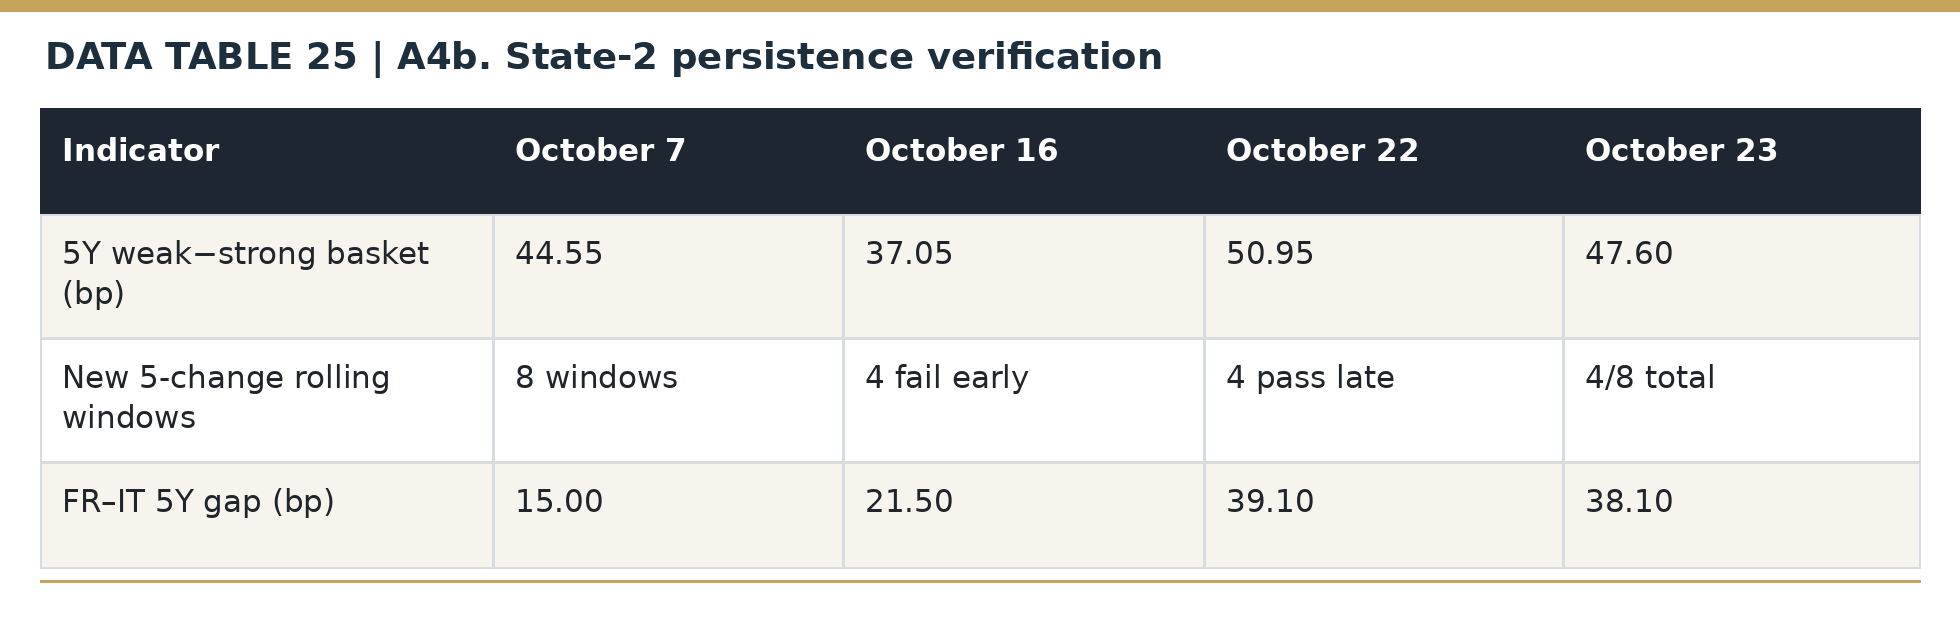
The higher-risk peer group contains Italy and Spain; the stronger-core group contains Austria and the Netherlands. We selected these fixed groups because they offer two relatively higher-debt sovereigns and two comparatively stronger credit-quality benchmarks within the currency union. The five-year group spread rose from 44.55bp on October 7 to 47.60bp on October 23 (+3.05bp), following a trough of 37.05bp on October 16. Across the twelve intervening daily changes, the peer-gap increased in at least three out of five sessions in four of eight overlapping windows, all at the end. Broadening remained selective and uneven. [9] [49] [50] [51]
A simple check is to compare sovereign-yield changes across countries directly, without subtracting the German yield from every observation. Co-movement remains evident among Italy, Spain, Austria and the Netherlands. The historical statistical test in Appendix A3 confirms the result using monthly data before the 2026 events; our current assessment relies primarily on the transparent four-country comparisons above.
A simple cross-country check of common repricing
Why make this comparison? If every European country is measured against Germany, a change in Bund yields can make several bilateral spreads move together automatically. Comparing the countries’ raw yield changes provides a cross-check. We use an equal-weight average across all four peers and then compare the relatively higher-risk pair (Italy, Spain) with the stronger pair (Austria, Netherlands). France is excluded from defining the peers so that the market under study does not determine the reference group.
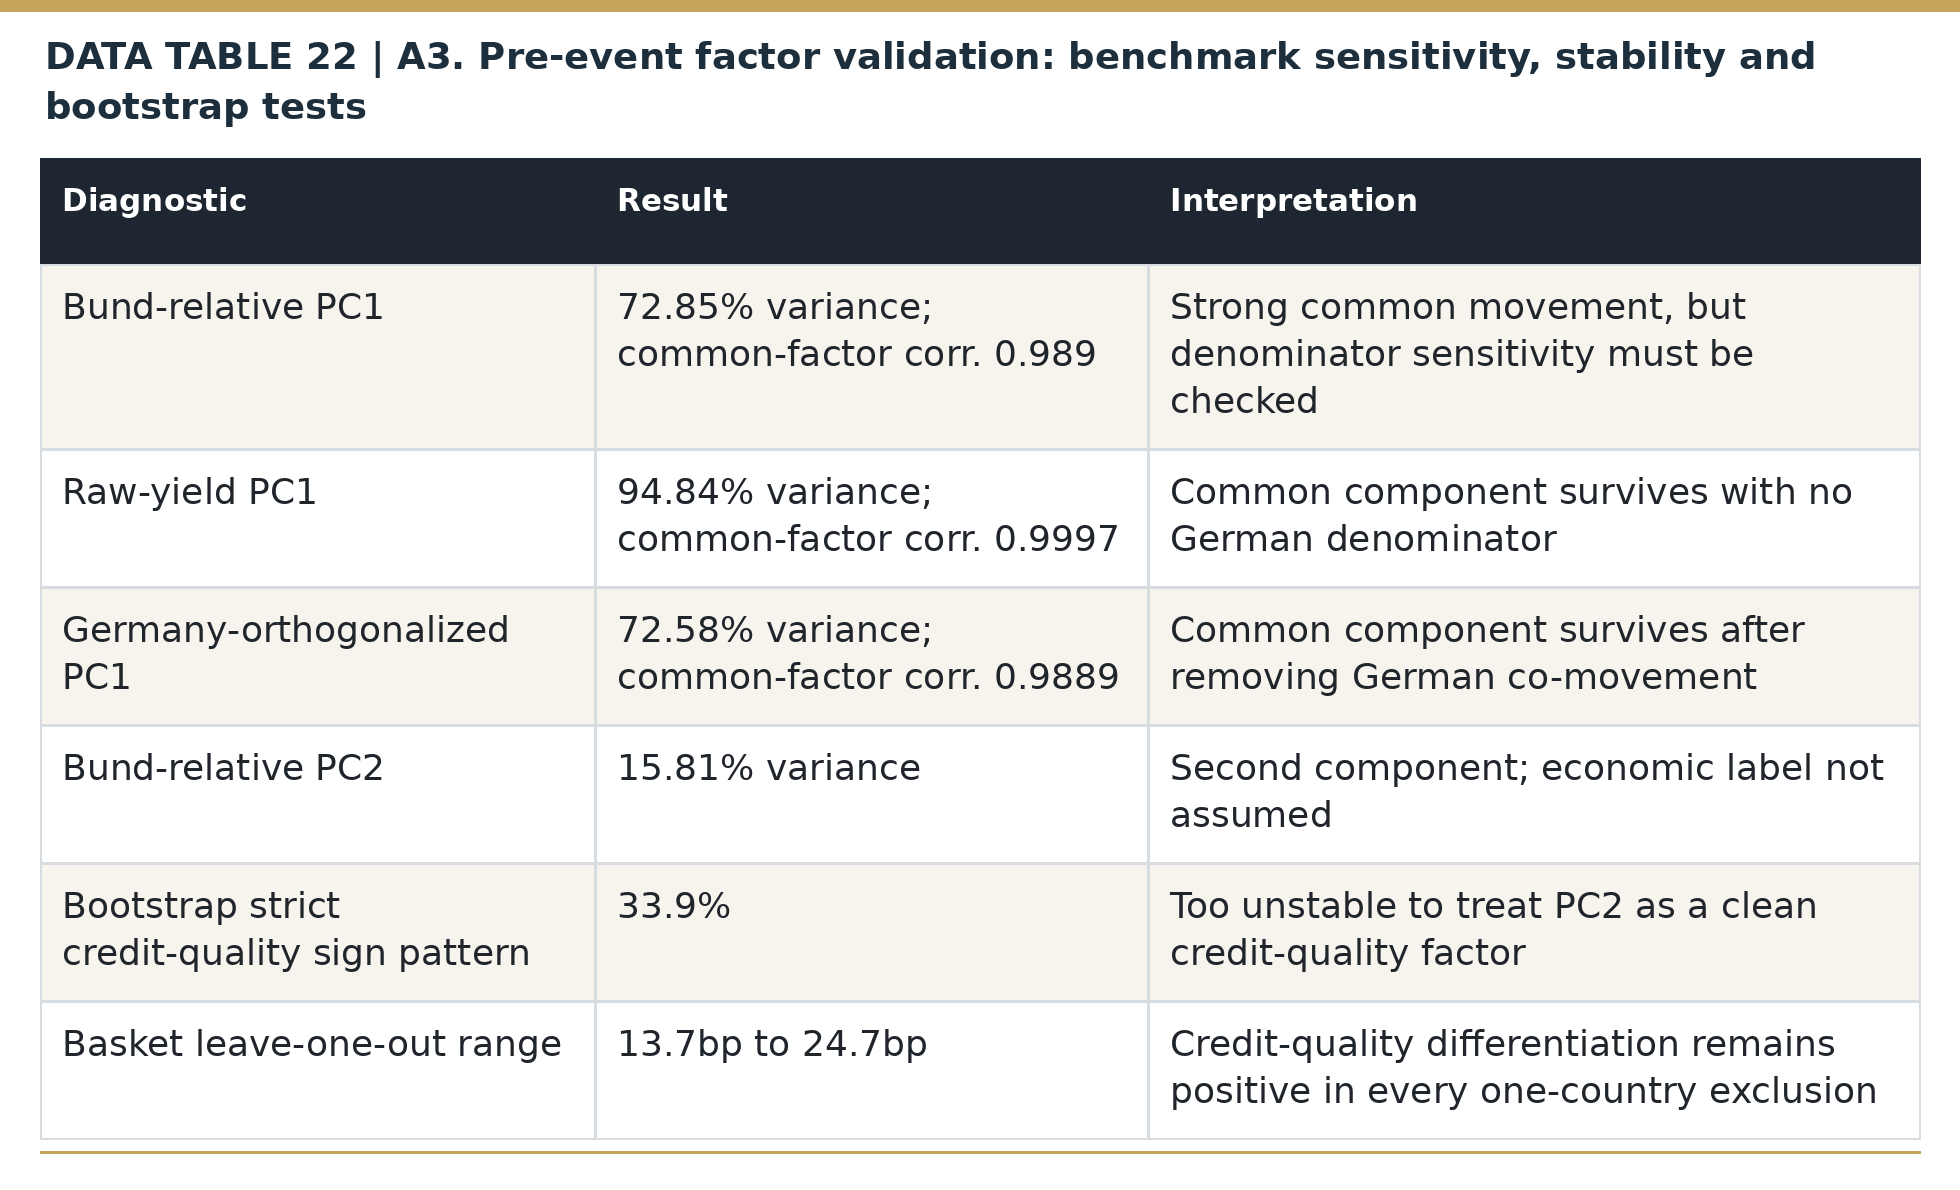
In an independent 2020–July 2025 historical panel, the first common statistical component explains 94.84% of variation in raw monthly peer-yield changes; it also remains present when the German yield is statistically removed. The common movement therefore reflects more than a shared denominator. Technical estimates, bootstrap checks and caveats are in Appendix A3. [38]
The second statistical component is unstable across specifications, which is why the article evaluates credit-quality differences with the explicit Italy/Spain versus Austria/Netherlands group average rather than a model-generated label.
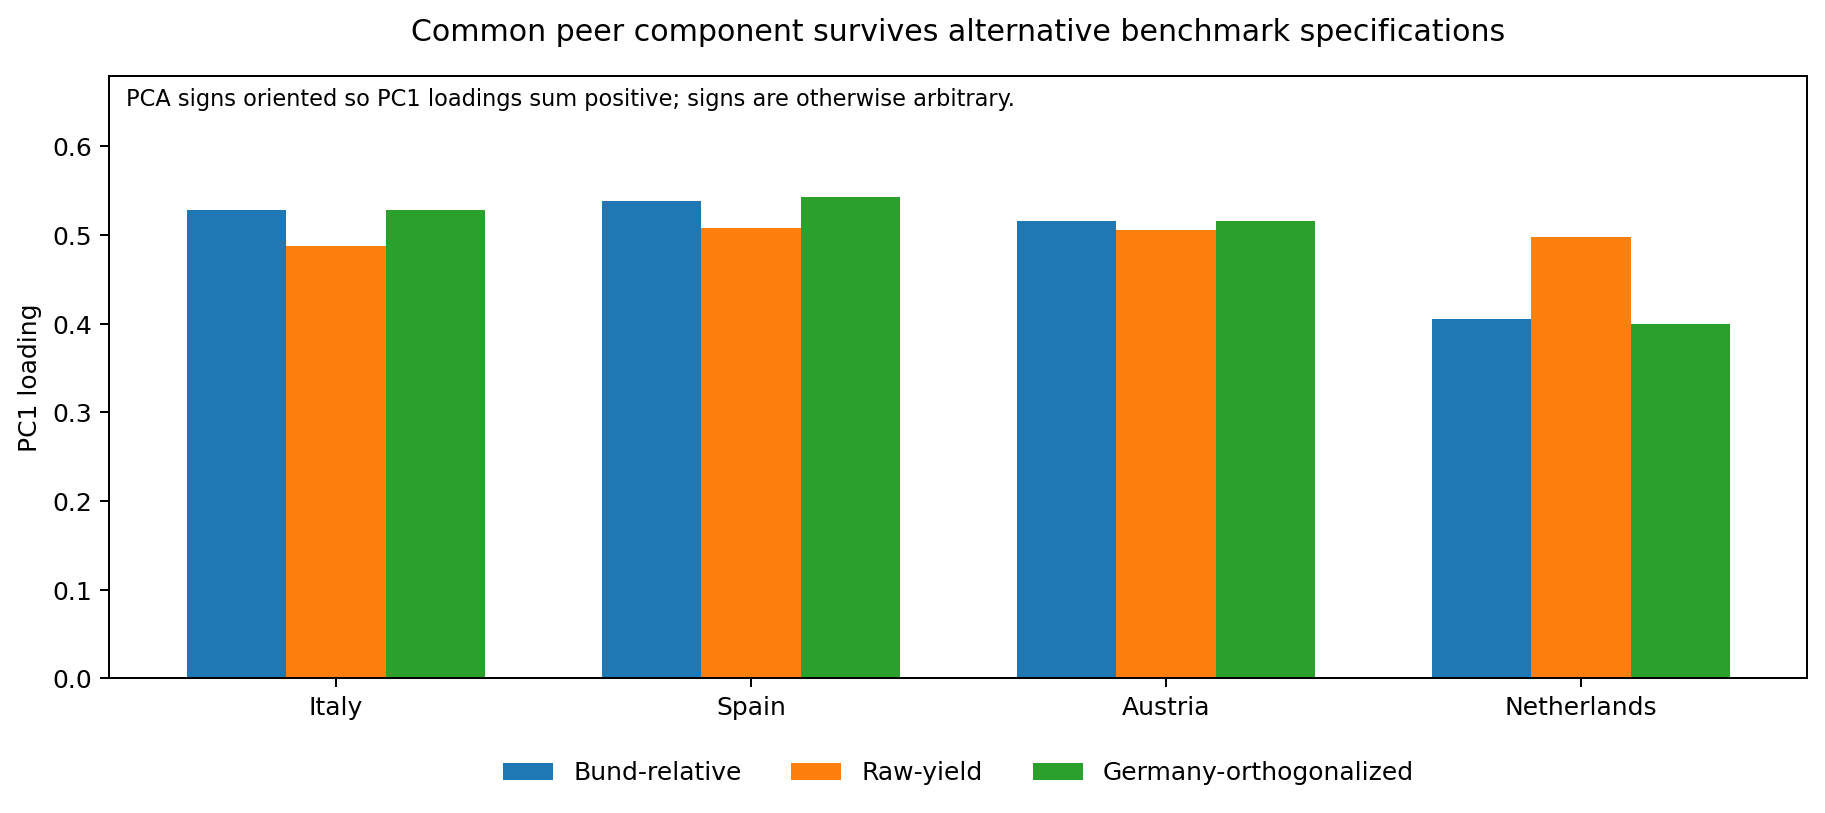
Figure 3. Common historical peer-yield movement under three benchmark conventions (technical cross-check; see Appendix A3).
Source: SharpeEdge calculations from OECD monthly 10-year benchmark government yields via FRED, February 2020–July 2025. PCA signs are arbitrary; PC1 is oriented so the average peer loading is positive. [38]
France compared with four European sovereign peers
Italy, Spain, Austria and the Netherlands provide four comparable sovereign markets around France. Italy has a high debt ratio and historically strong co-movement with French spreads; Spain provides a second southern European comparator; Austria and the Netherlands are comparatively stronger-credit core markets. Their differences in debt, liquidity and issuance are useful for testing whether France’s widening spread is unique or part of a broader pattern. [38]
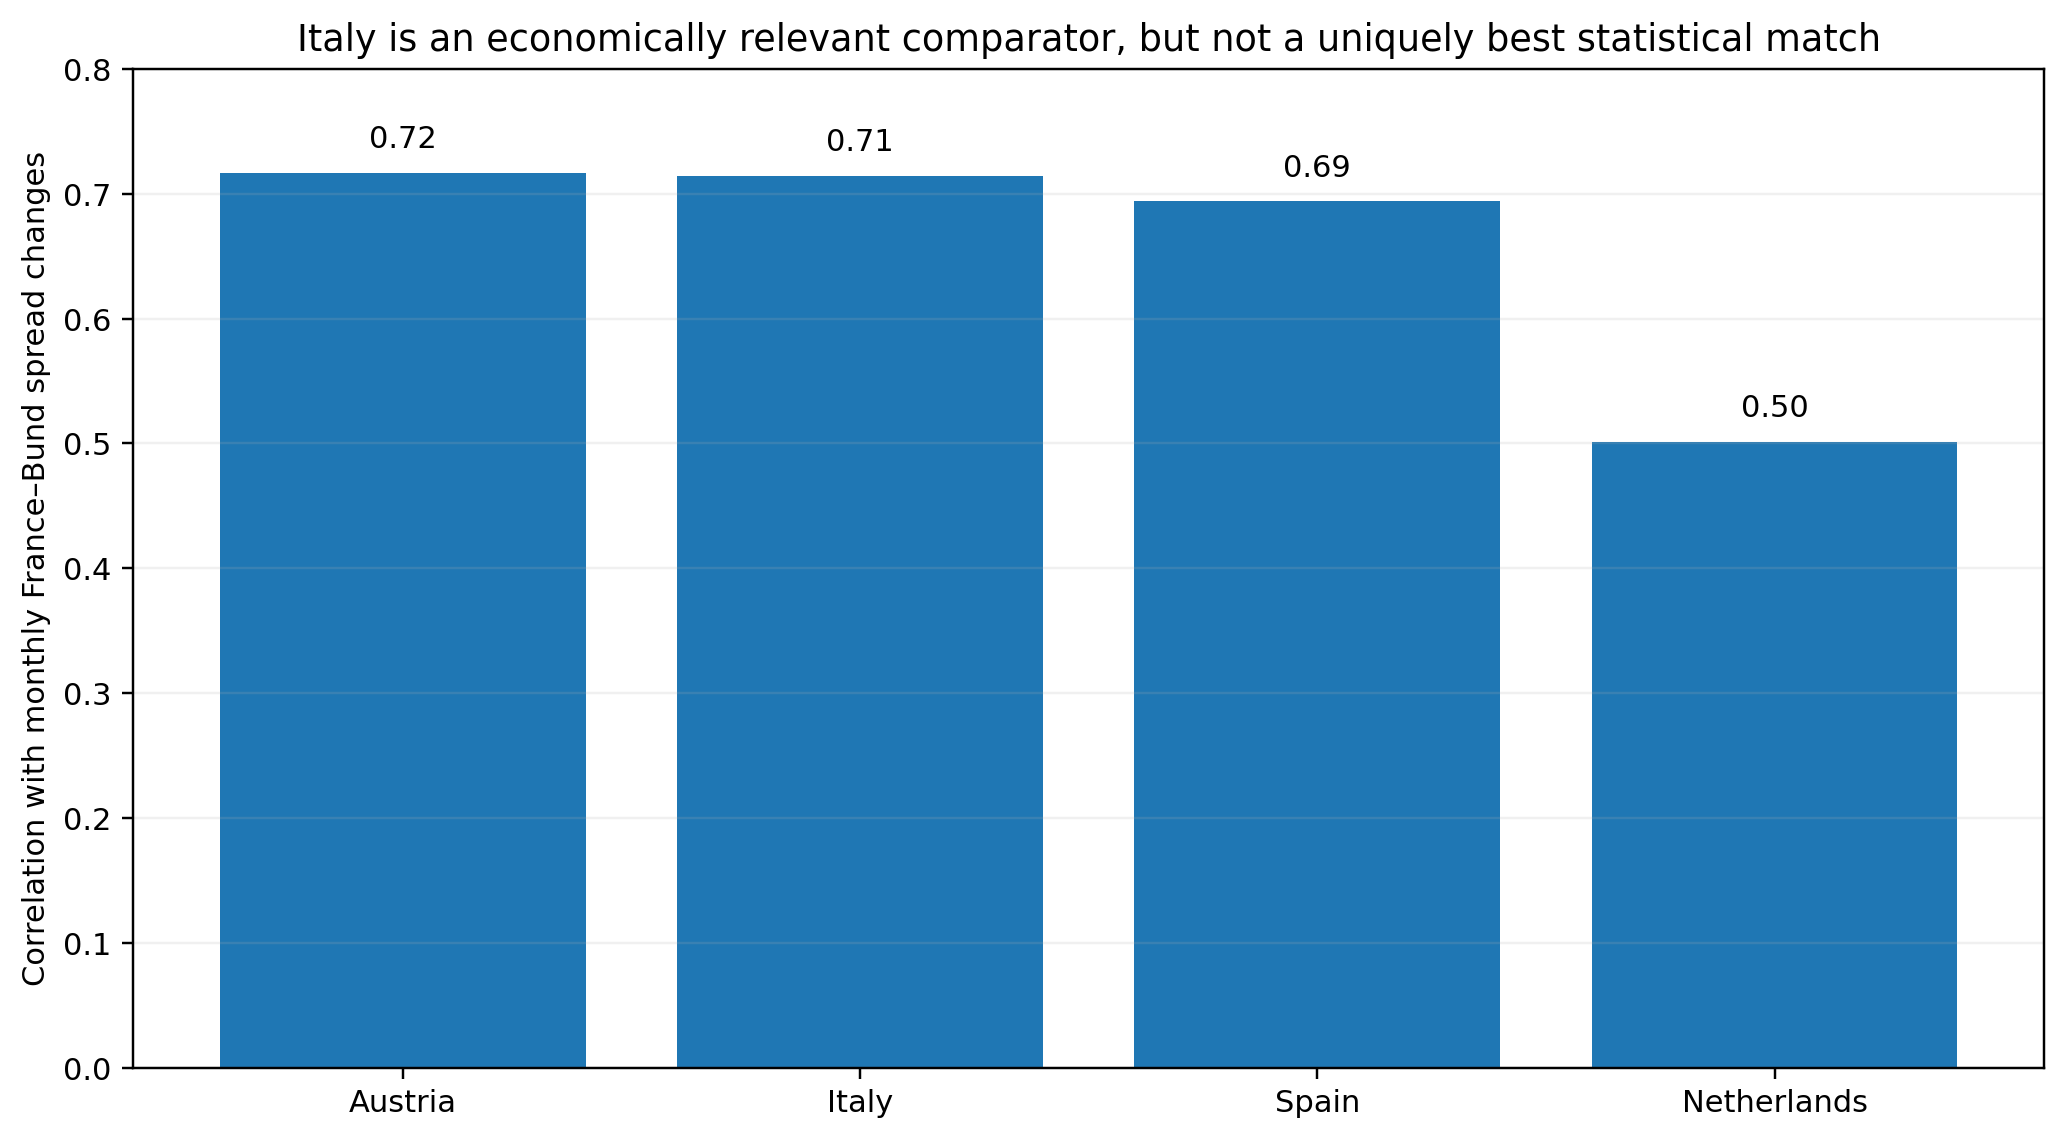
Figure 4. Historical France spread correlations with Austria, Italy, Spain and the Netherlands.
Source: SharpeEdge calculations from OECD monthly 10-year benchmark government yields via FRED, January 2020–July 2025. Bars show correlations of monthly changes in each country’s spread to Germany with the France–Germany spread change. [38]
Table: France’s five-year relative-premium widening versus all four peer sovereigns, in basis points.
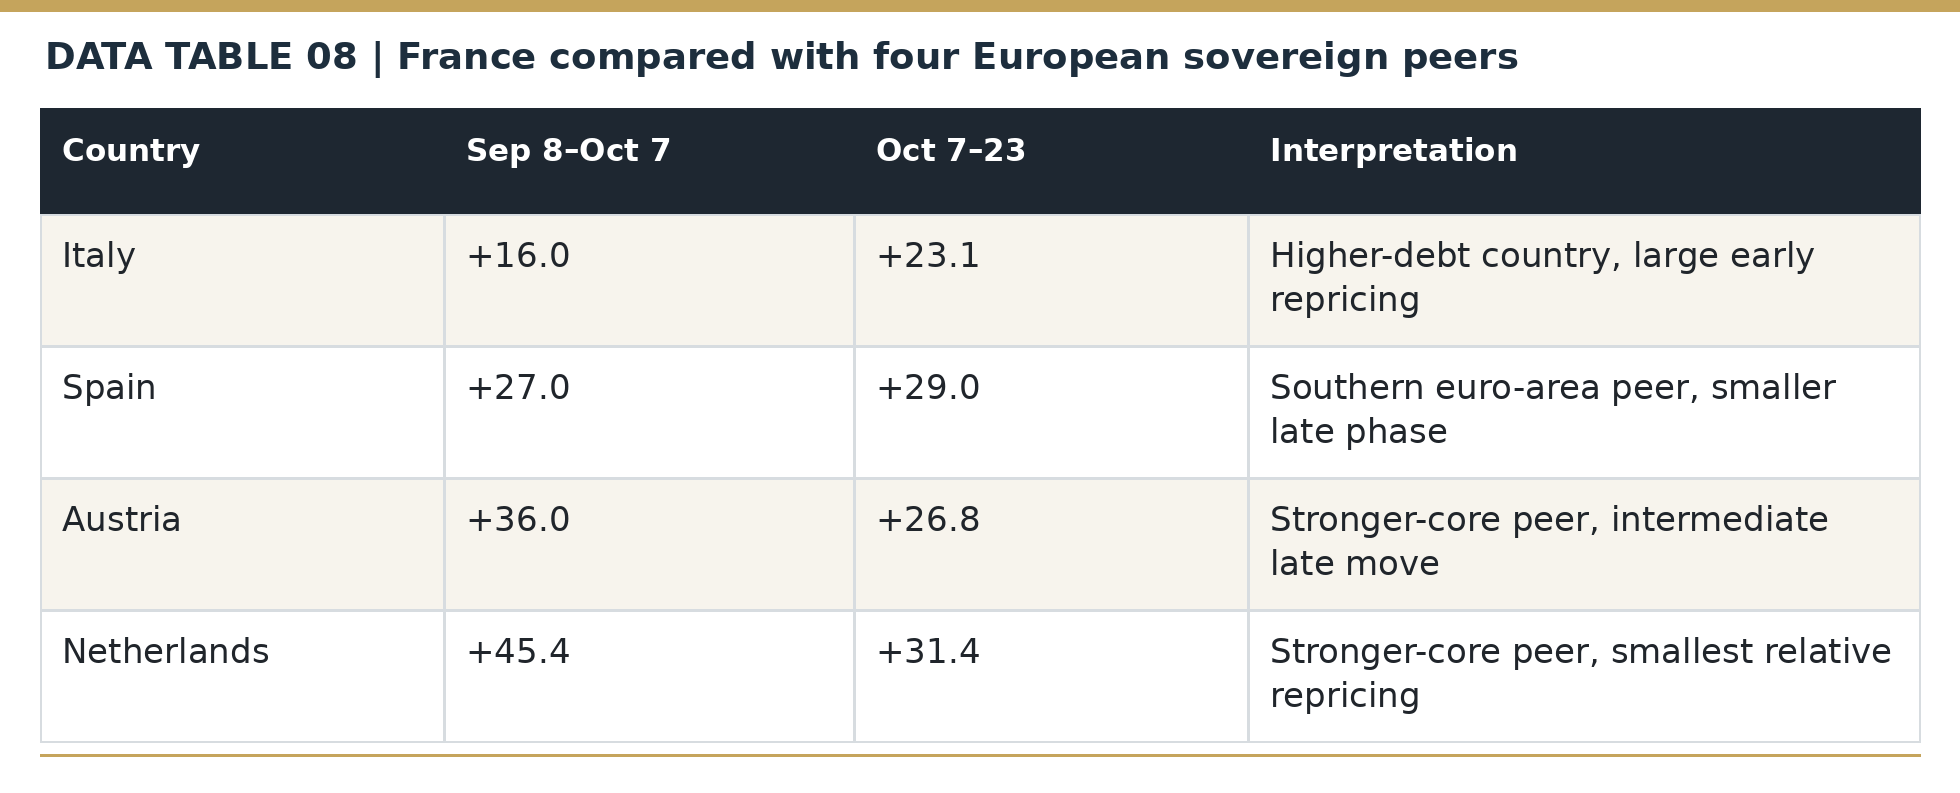
For each of these four sovereigns, we measure the change in the French yield premium relative to that peer: Δ(FR−peer). Since the same five-year swap rate is subtracted from both markets, it cancels when computing each pairwise yield difference.

Between September 8 and October 7, France’s five-year premium increased 16.0bp more than Italy’s, 27.0bp more than Spain’s, 36.0bp more than Austria’s and 45.4bp more than the Netherlands’. Between October 7 and October 23, the excess was 23.1bp versus Italy, 29.0bp versus Spain, 26.8bp versus Austria and 31.4bp versus the Netherlands. France therefore led in each comparison, with the four peers following different paths. [6] [8] [9] [49] [50] [51]
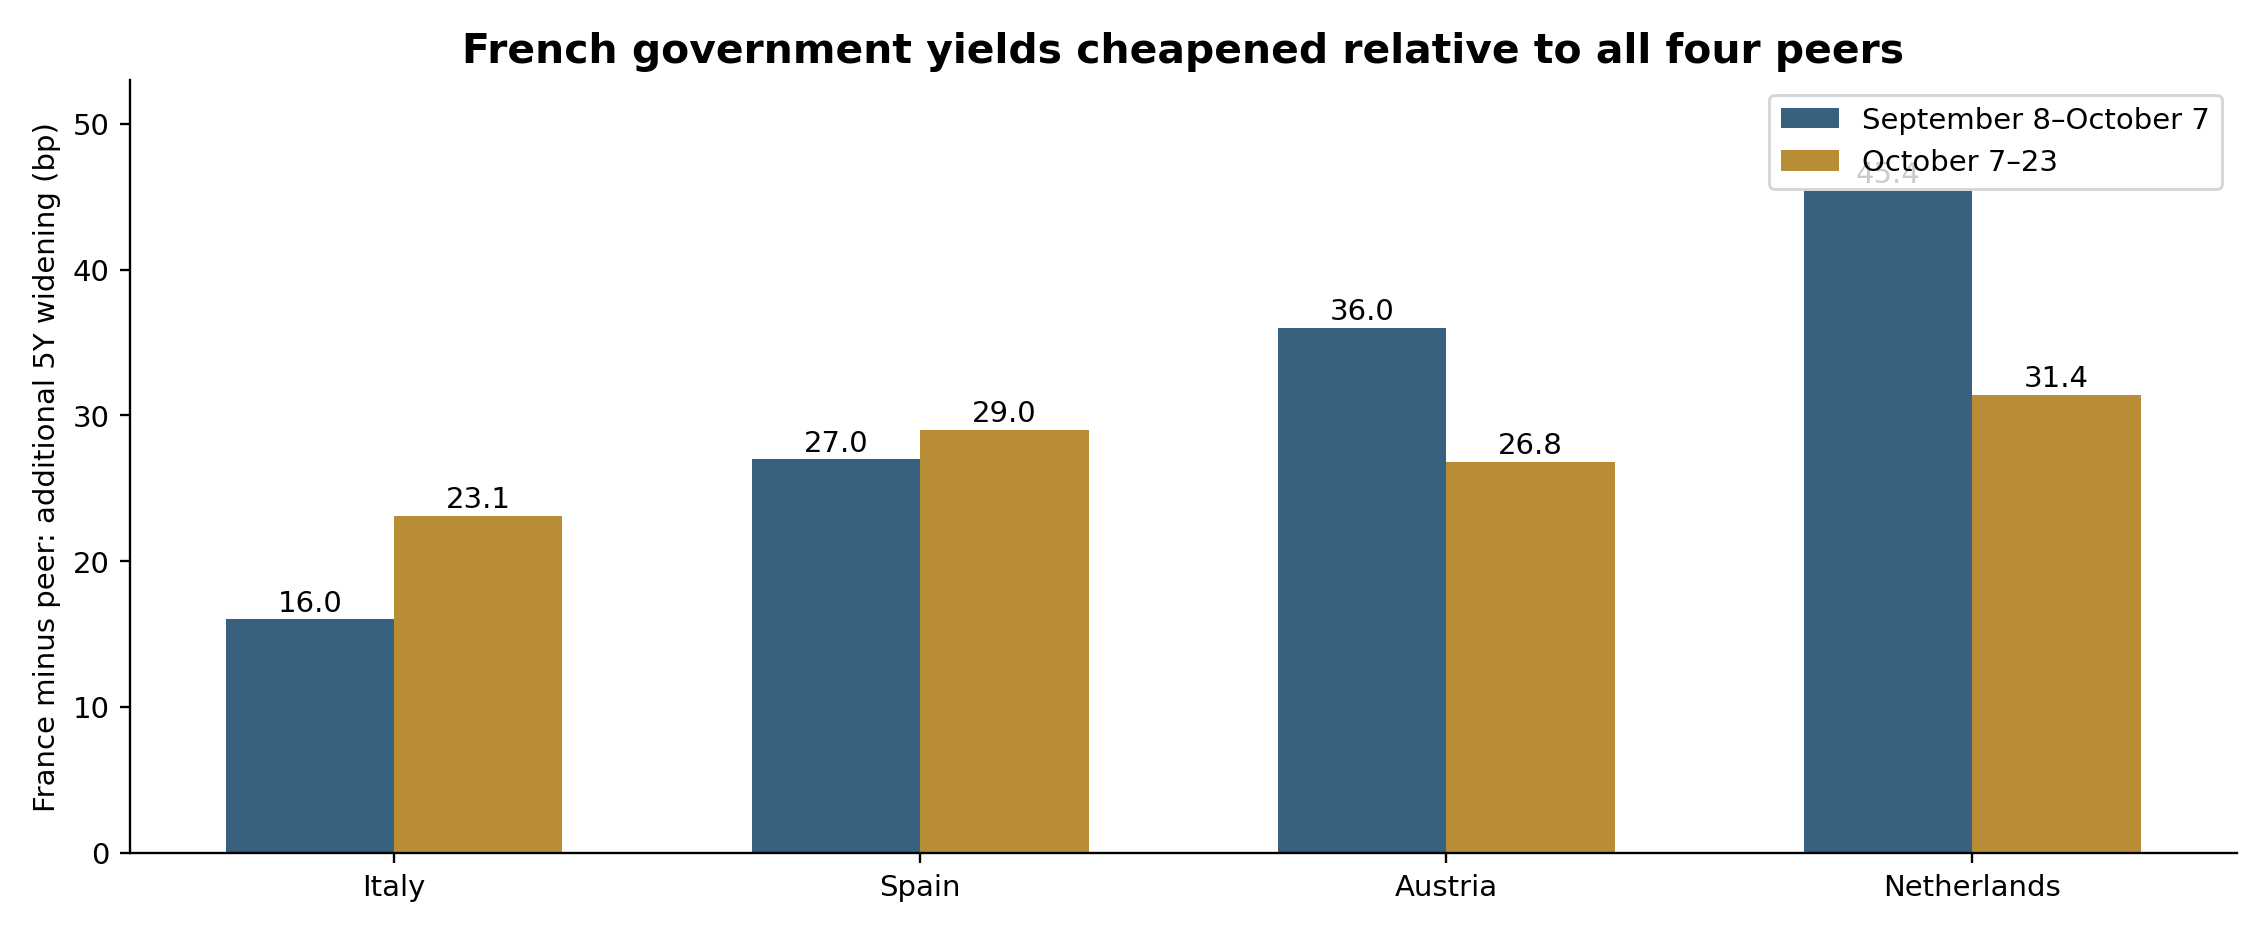
Figure 5. French five-year sovereign-yield premium widened relative to all four European peers in both observed periods.
Source: SharpeEdge calculations from French, Italian, Spanish, Austrian and Dutch five-year yields, expressed as changes in France-minus-peer spreads. [6] [9] [49] [50] [51]
All four comparisons indicate that French yields cheapened relative to other sovereigns. Italy saw the largest sovereign-yield repricing of the four peers in the early phase; Austria temporarily experienced more late-phase widening than Spain. The Netherlands showed the strongest resistance to the broader selloff. This pattern distinguishes French leadership from the separate question of whether the higher-risk peer group is still diverging from the stronger-core group. [6] [9] [49] [50] [51]
How French sovereign stress affects euro exchange rates
EUR/USD and EUR/CHF incorporate several interacting forces: expected Federal Reserve, ECB and Swiss National Bank policy; unexpected central-bank decisions; relative growth and inflation surprises; oil and gas prices and other terms-of-trade shocks; global risk sentiment and demand for safe-haven dollars or Swiss francs; portfolio and hedging flows; cross-border funding conditions; and confidence in euro-area public finances. The importance of each force varies with the episode. Between the ECB fixings on October 7 and October 23, EUR/USD increased 0.14% while EUR/CHF fell 0.88%, even as France’s sovereign premium widened. [41] [68] [76] [77]
Exchange-rate prices respond to news relative to expectations. A change in the expected path of ECB policy can move the euro exchange rate before a decision occurs; a scheduled announcement matters when the rate or guidance differs from what traders had priced. Likewise, fiscal news can move sovereign assets without moving currencies if its content was anticipated. An event-time comparison needs market expectations immediately before the release to isolate a surprise. [14] [32]
Historical FX test: French spreads and euro exchange-rate behavior
We test whether monthly French sovereign-spread changes are associated with movements in EUR/USD or EUR/CHF after controlling for other rates and European sovereign prices. For 66 months between February 2020 and July 2025, we estimate:

. The coefficient βFR measures an average conditional association across those months, and the historical sample ends before the September 2025 political and credit events. [38] [39] [40] [41] [42]
For EUR/USD, the model explains about 35% of variation in monthly currency changes over the full sample. Its French-spread coefficient is +0.106, but it differs markedly between 2020–22 (+0.233) and 2023–July 2025 (−0.026); the formal difference is statistically significant. With a shorter-term interest-rate control, explanatory power falls to about 11% and the French coefficient is statistically indistinguishable from zero. Figure 6 displays coefficient estimates and uncertainty bands: if a band crosses zero, the sign is not established by that subsample. The variation across specifications warns against treating one coefficient as a permanent euro response to a French budget shock. [39] [42] [43]
For EUR/CHF, the full model explains approximately 11% of monthly currency variation and the France-specific coefficient is not statistically significant (p=0.121). The change in that coefficient between the two subsamples also fails a statistical significance test. In practical terms, French sovereign news may matter for EUR/CHF on individual days, but the historical monthly relationship is too unstable and imprecise to use as a standalone prediction.
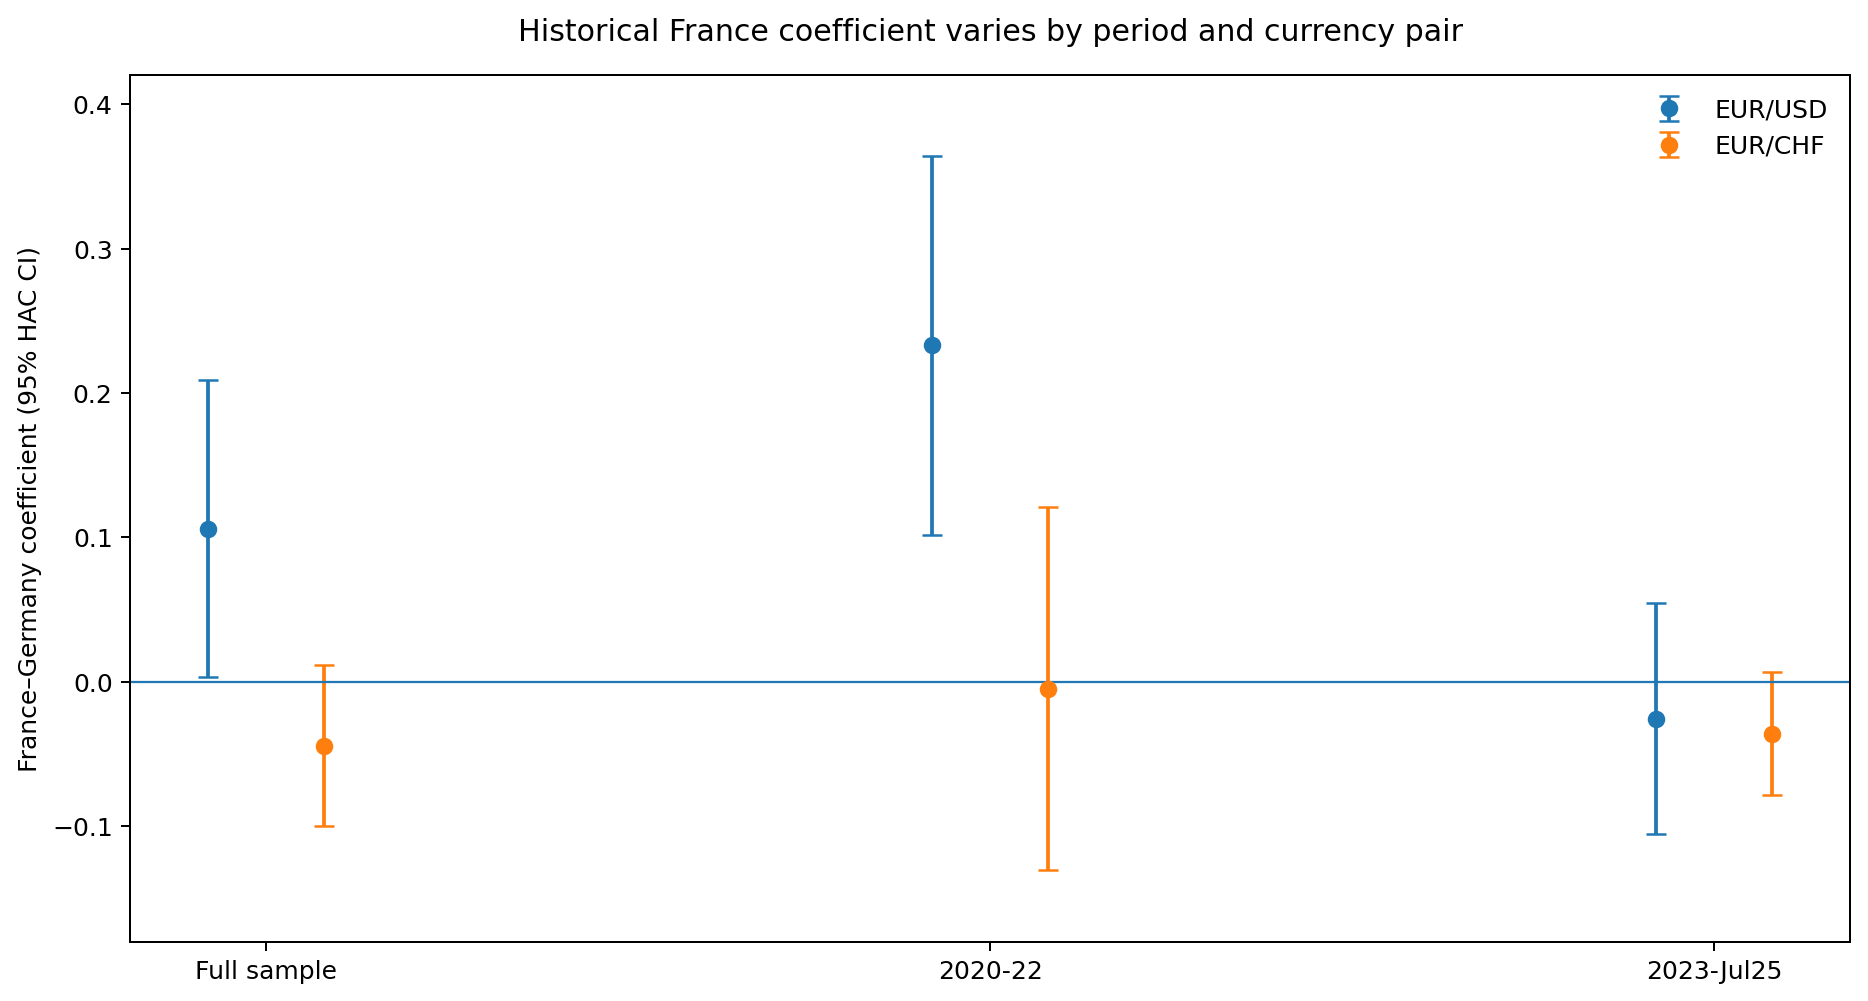
Figure 6. Conditional monthly FX responses to the French–German spread: historical coefficients and 95% confidence intervals, February 2020–July 2025.
Source: SharpeEdge calculations from OECD sovereign/rate series, Federal Reserve EUR/USD data and the ECB direct EUR/CHF reference-rate series. Monthly sample February 2020–July 2025; HAC standard errors with three lags. Formal fully interacted break tests are reported in Appendix A5. [38] [39] [40] [41] [42] [43]
French political news and euro exchange rates: why expectations matter
French information shocks have produced different currency responses. In 2017, reduced euro-exit risk supported the euro exchange rate; in June 2024 a surprise dissolution coincided with immediate euro weakness; and in September 2025 an anticipated Fitch downgrade produced little additional movement. During October 2026, the euro exchange rate also reacted to global rates, energy prices and safe-haven demand, so daily sovereign/FX comparisons must be interpreted alongside the news investors had already priced. [20] [23] [24] [41] [68]
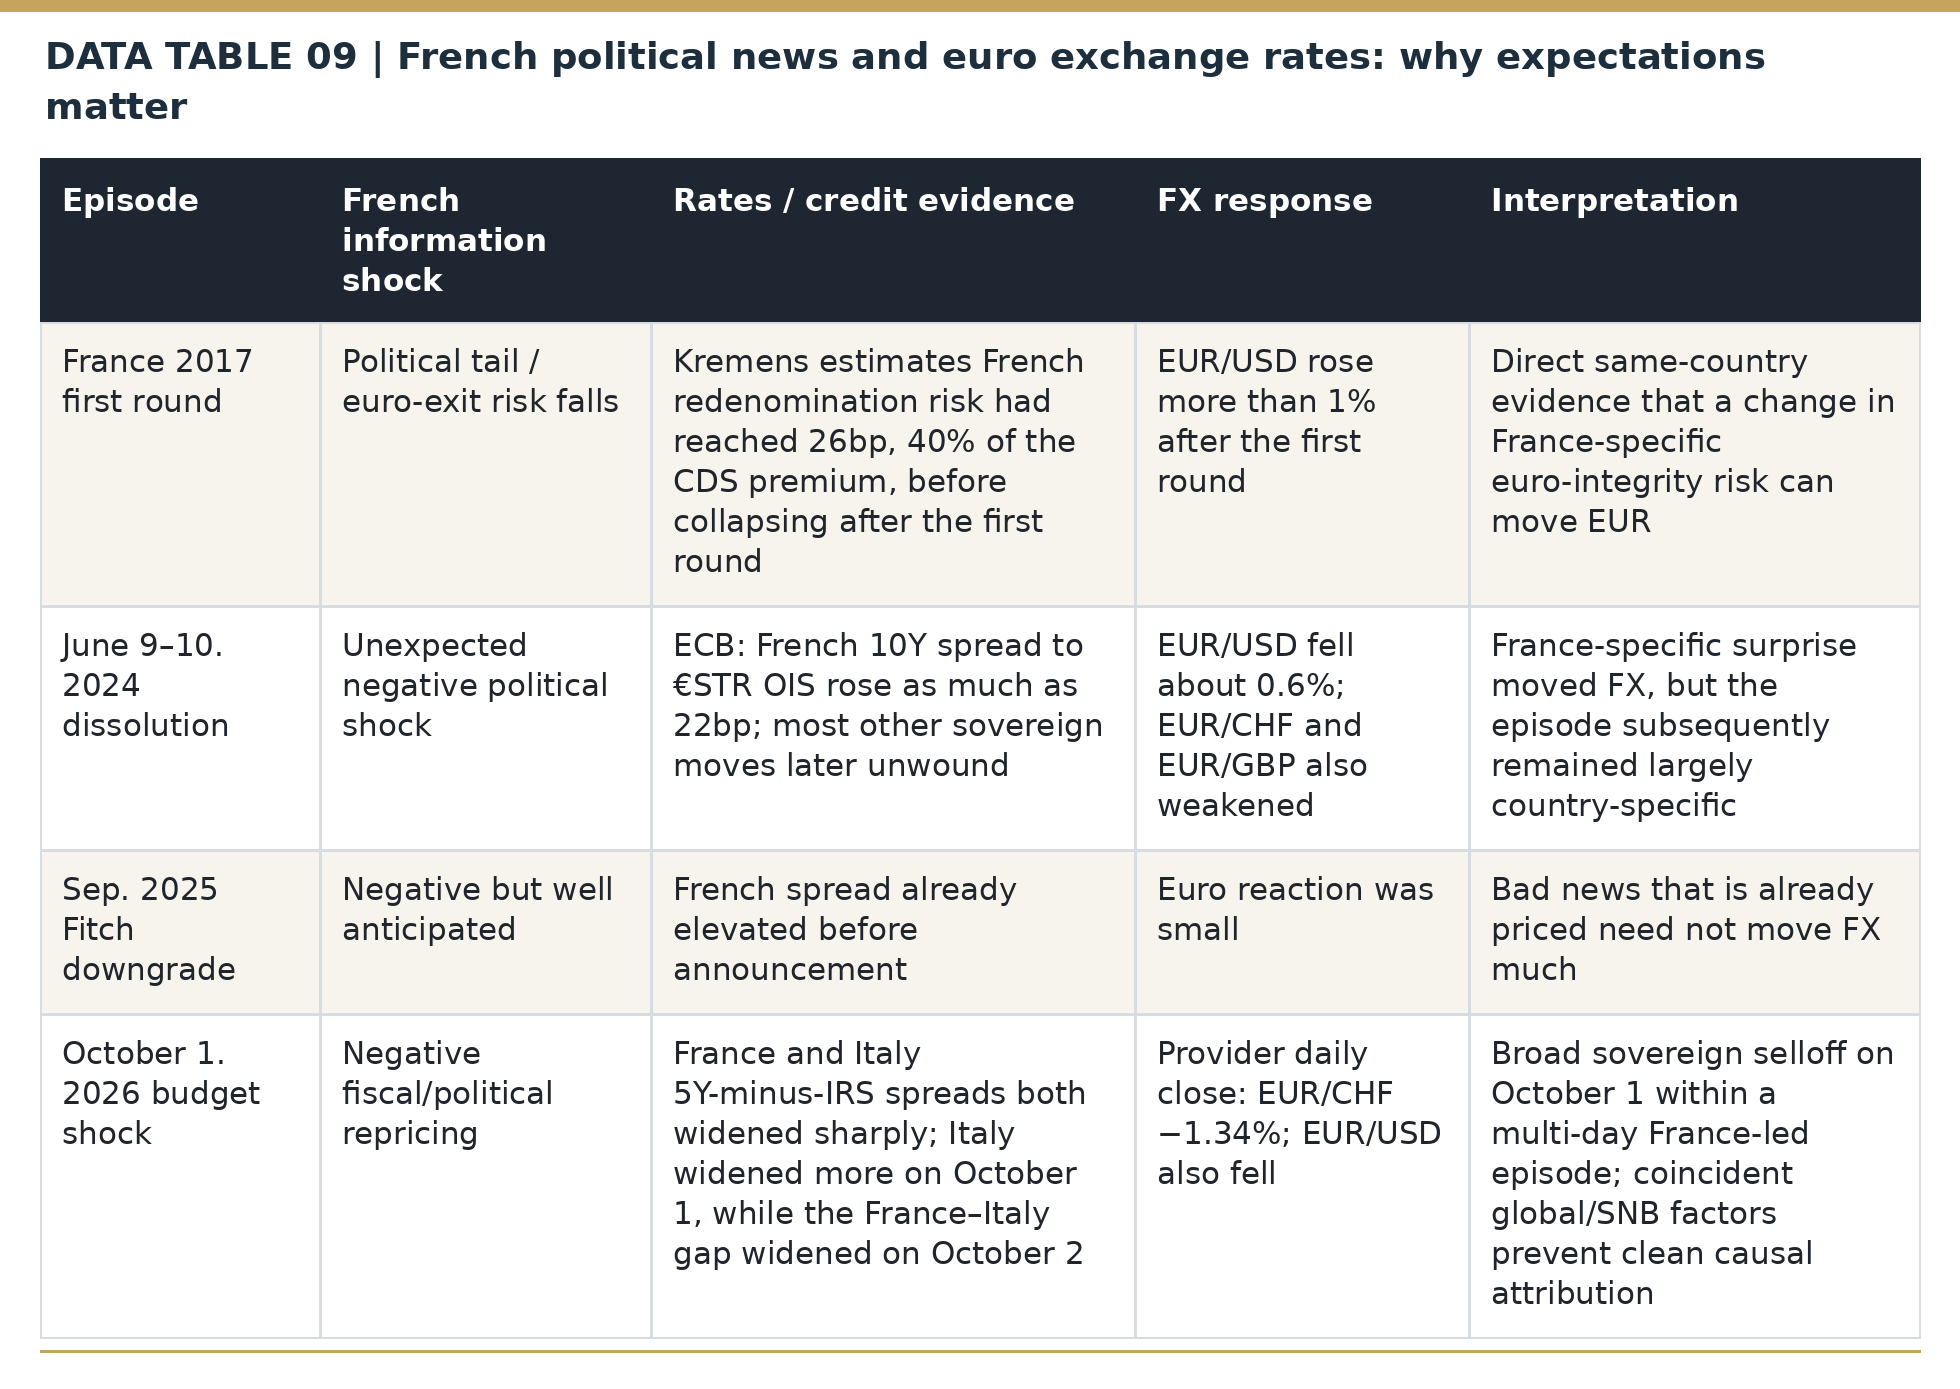
Daily fixing conventions matter when dating an FX response. The ECB recorded EUR/CHF at 0.9437 on October 1 and 0.9279 on October 2, a 1.67% decline between fixes. The wider October 7–23 comparison uses the same ECB reference convention for EUR/USD and EUR/CHF throughout. [41] [68]
Results from existing research on sovereign stress and euro exchange-rate transmission
Evidence from a Banque de France research paper shows that sovereign-spread shocks can be associated with euro depreciation when investors fear fragmentation in the currency union. Istrefi, Pagliari and Szczerbowicz (2021) use short windows around ECB announcements and identify statistically significant currency effects for Italian and Spanish sovereign spreads. Their setting concerns ECB-related surprises, while French fiscal events require separate timing checks. [14]
The evidence from an IMF research report indicates that euro-area credit markets become more sensitive to global risk shocks when sovereign financing conditions are already fragmented. Mosk and de Vette (2025) quantify the effect using sovereign CDS and corporate bond spreads. Their findings establish a bond-market amplification mechanism that can make euro-area risks relevant for currencies through financial conditions. [15]
Lukas Kremens, a financial economist, estimates that currency-redenomination risk accounted for around 26bp of French sovereign CDS pricing in March 2017, approximately 40% of the premium. Redenomination would mean some euro-denominated sovereign obligations being converted into a new national currency after a break with monetary union. If investors expect that currency to depreciate, the value of their claims falls in euro terms, raising the compensation they require to insure or hold the debt. Kremens isolates this component by comparing CDS contracts with different currency and legal provisions. [20]
Taken together, the historical evidence suggests three conditional euro exchange-rate channels: revisions to relative short-rate paths, changes in demand for risky or safe-haven European assets, and rare concerns about the integrity of the monetary union. The historical EUR/USD French-spread coefficient differs substantially across periods, while the EUR/CHF coefficient is imprecise. Changes in market expectations and other global shocks therefore matter for translating French political events into exchange-rate outcomes. [14] [15] [20] [38] [39] [40] [41]
Why priced-in news can leave euro exchange rates unchanged
A bond-yield move or ratings announcement need not surprise currency investors. For example, the five-year euro swap rate rose about 16.4bp on September 23 without a comparable widening in France’s premium; during October 7–23, French CDS and bond prices deteriorated even though EUR/USD rose 0.14% and EUR/CHF fell 0.88%. Each pair combines the fiscal shock with other expected-rate, energy and safe-haven news. Separating anticipated changes from surprises requires rates futures and intraday exchange rates around each announcement. [8] [10] [41] [68]
Synthesis: when sovereign stress reaches the euro exchange rate
French fiscal weakness first changes the expected returns and credit compensation on French sovereign debt. It reaches the euro exchange rate when those losses affect a wider set of European investors’ expected policy rates, portfolio allocations, funding access or confidence in monetary union. The October evidence shows rising France-specific bond and CDS premiums with intermittent peer-country transmission, whereas EUR/USD and EUR/CHF moved in opposite directions. The historical event evidence likewise suggests that surprise content and broader market conditions matter more than the nominal size of any single spread change.
Bank credit: Lessons from a small cross-country sample
Five-year CDS quotations for BNP Paribas, Société Générale and Crédit Agricole provide a view of French bank credit risk. UniCredit and Deutsche Bank supply two non-French comparisons. Between October 2 and the latest quotes on October 22–23, the French banks’ CDS widened by 2.22bp, 8.10bp and 5.50bp respectively; the non-French banks widened by 3.21bp and 2.38bp. In each case, a wider CDS premium means investors are charging more to insure that bank’s debt. [11] [12] [13] [72] [73]
An equal-weight comparison of these five banks illustrates the breadth of repricing. The three French names widened by 5.27bp on average (+7.9% of their October 2 premiums), against 2.80bp (+5.2%) for UniCredit and Deutsche Bank. The French-bank average therefore increased about 2.48bp more over this period. These are descriptive issuer-level comparisons; a market-capitalization-weighted or European sector-wide CDS analysis would require a common daily series for additional banks. [11] [12] [13] [72] [73]
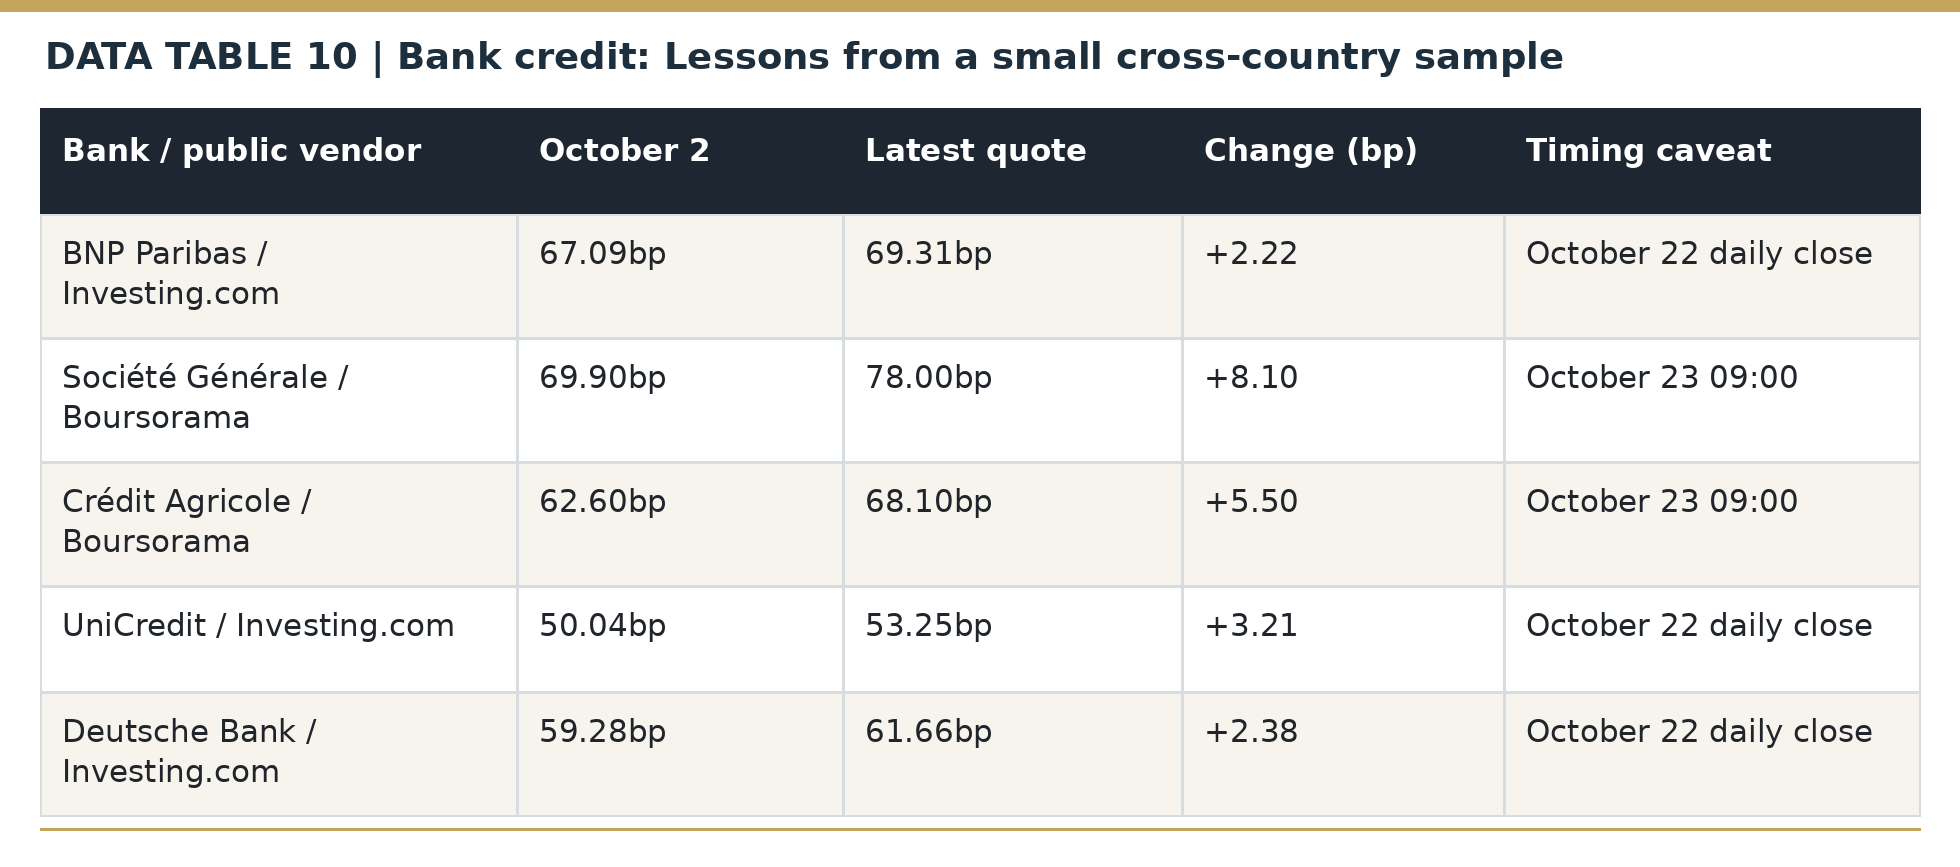
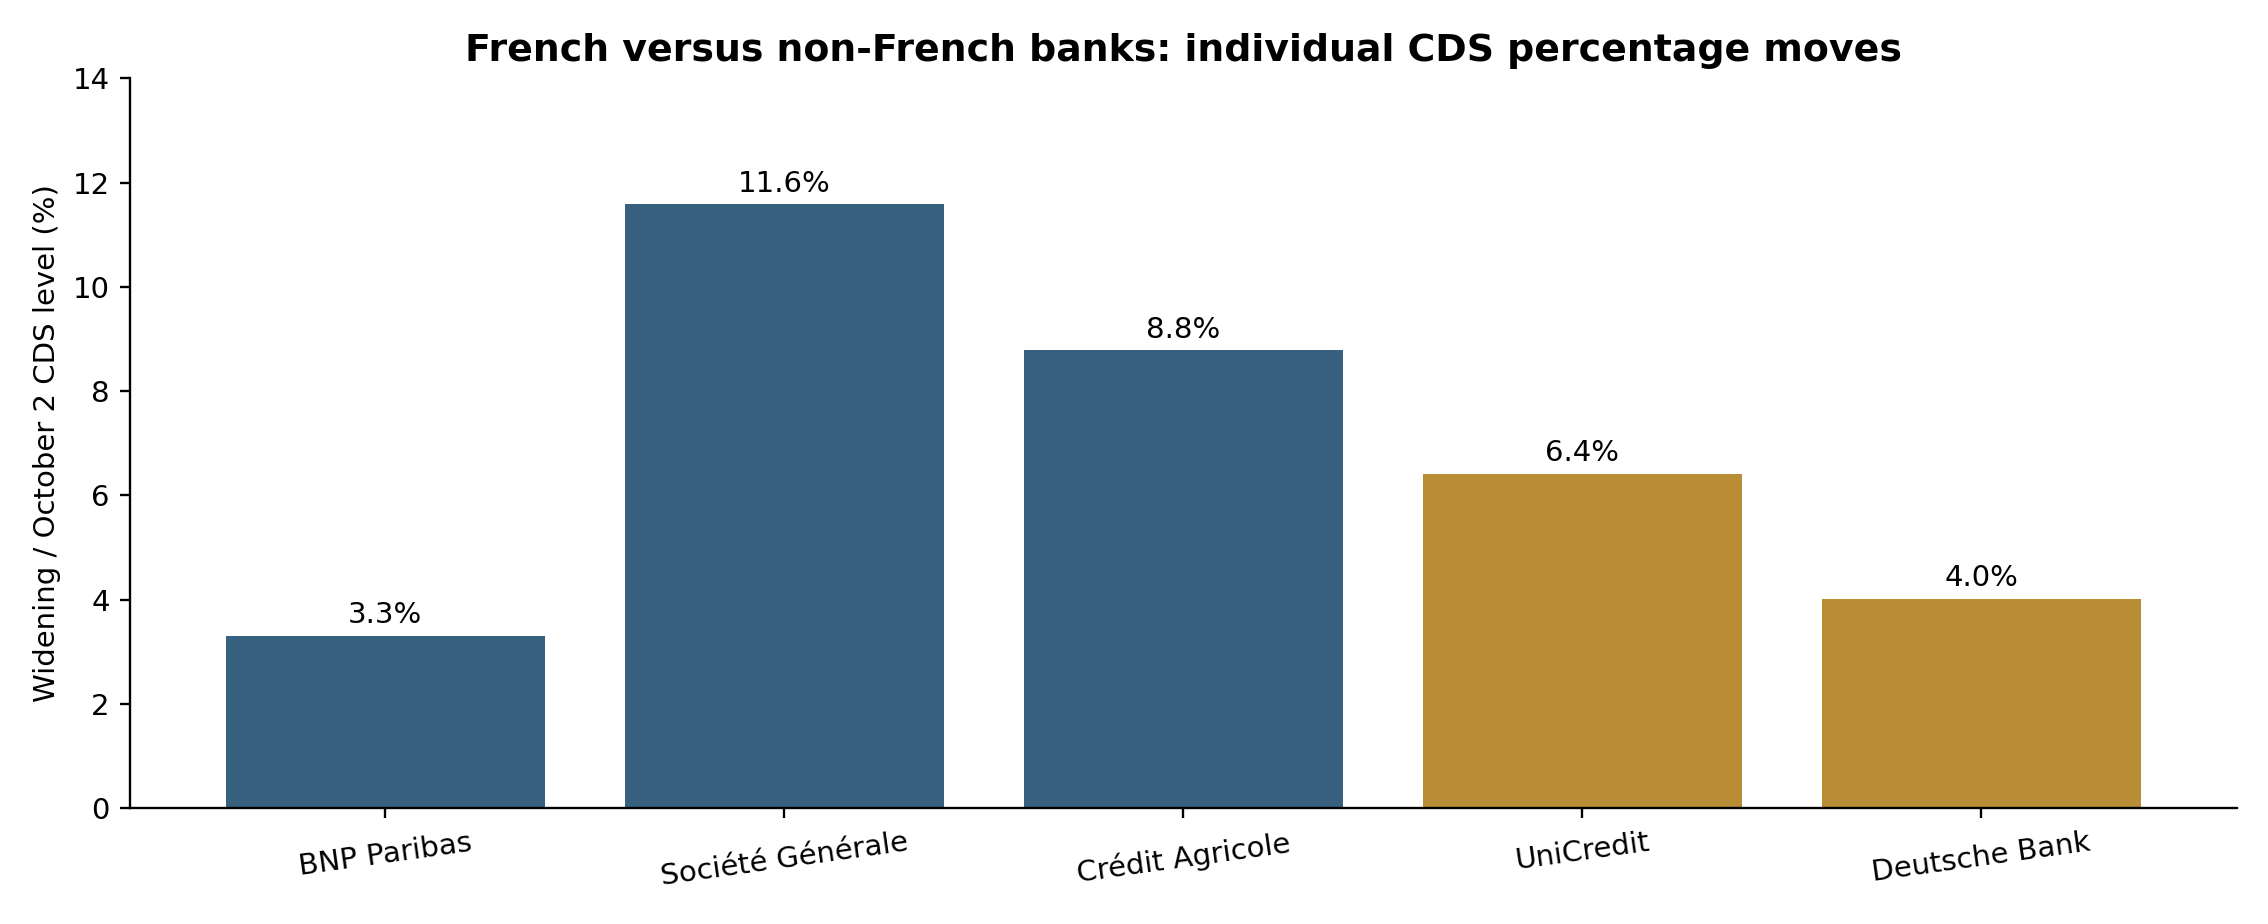
Figure 7. Individual French and non-French bank credit-insurance premiums, percentage widening from October 2 to the latest October 22–23 quotes.
Source: bank five-year CDS levels from Investing.com and Boursorama. Relative changes are calculated from each bank’s own October 2 quote and latest available quotation. [11] [12] [13] [72] [73]
The three French banks’ average increase exceeded that of the two foreign comparators by approximately 2.5bp, with Société Générale showing the largest rise. A broader European credit index, iTraxx Europe Senior Financials, spans 25 financial entities; publicly accessible historical series were insufficient to reproduce matching October 2 and October 23 group prices. The five-bank calculation therefore provides a transparent issuer-level signal, while wider deposit, funding and secondary-liquidity measures remain separate stages of the monitoring framework. [11] [12] [13] [72] [73] [78]
For a broader perspective, the EURO STOXX Banks index tracks a diversified set of European bank equities. Its prices are influenced by earnings, interest rates and equity-market conditions as well as credit risk, so they provide a complementary market signal rather than a direct replacement for matched bank CDS. [59]
French government-bond auctions: how investor demand evolved
The 3.70% November 2036 OAT was auctioned five times between June and October 2026. Its bid-to-cover ratio declined at every reopening: 2.41x, 2.38x, 2.33x, 2.28x and 2.00x. At the same time, its average auction yield rose from 3.80% in June to 4.93% on October 1, a 113bp increase. Tracking the identical security holds the coupon and maturity fixed and makes the weakening of demand coverage clearer. [2] [71] [74] [75]
Looking across all securities in each conventional long-term auction tells a similar, though less uniform, story. Aggregate bid-to-cover was approximately 2.65x in June, 2.51x in July, 2.68x in August, 2.66x in September and 2.29x on October 1. The October 15 auction covered shorter maturities and had 2.28x, so the maturity mix differs. The October 1 result was below the 2024 (2.50x) and 2025 (2.65x) comparable early-October sales, although above 2023 (2.06x). These figures measure competitive auction demand relative to supply; they do not fully isolate the effect of the fiscal news because maturity, supply volume and market yields also changed. [2] [54] [57] [58] [60] [71] [74] [75]
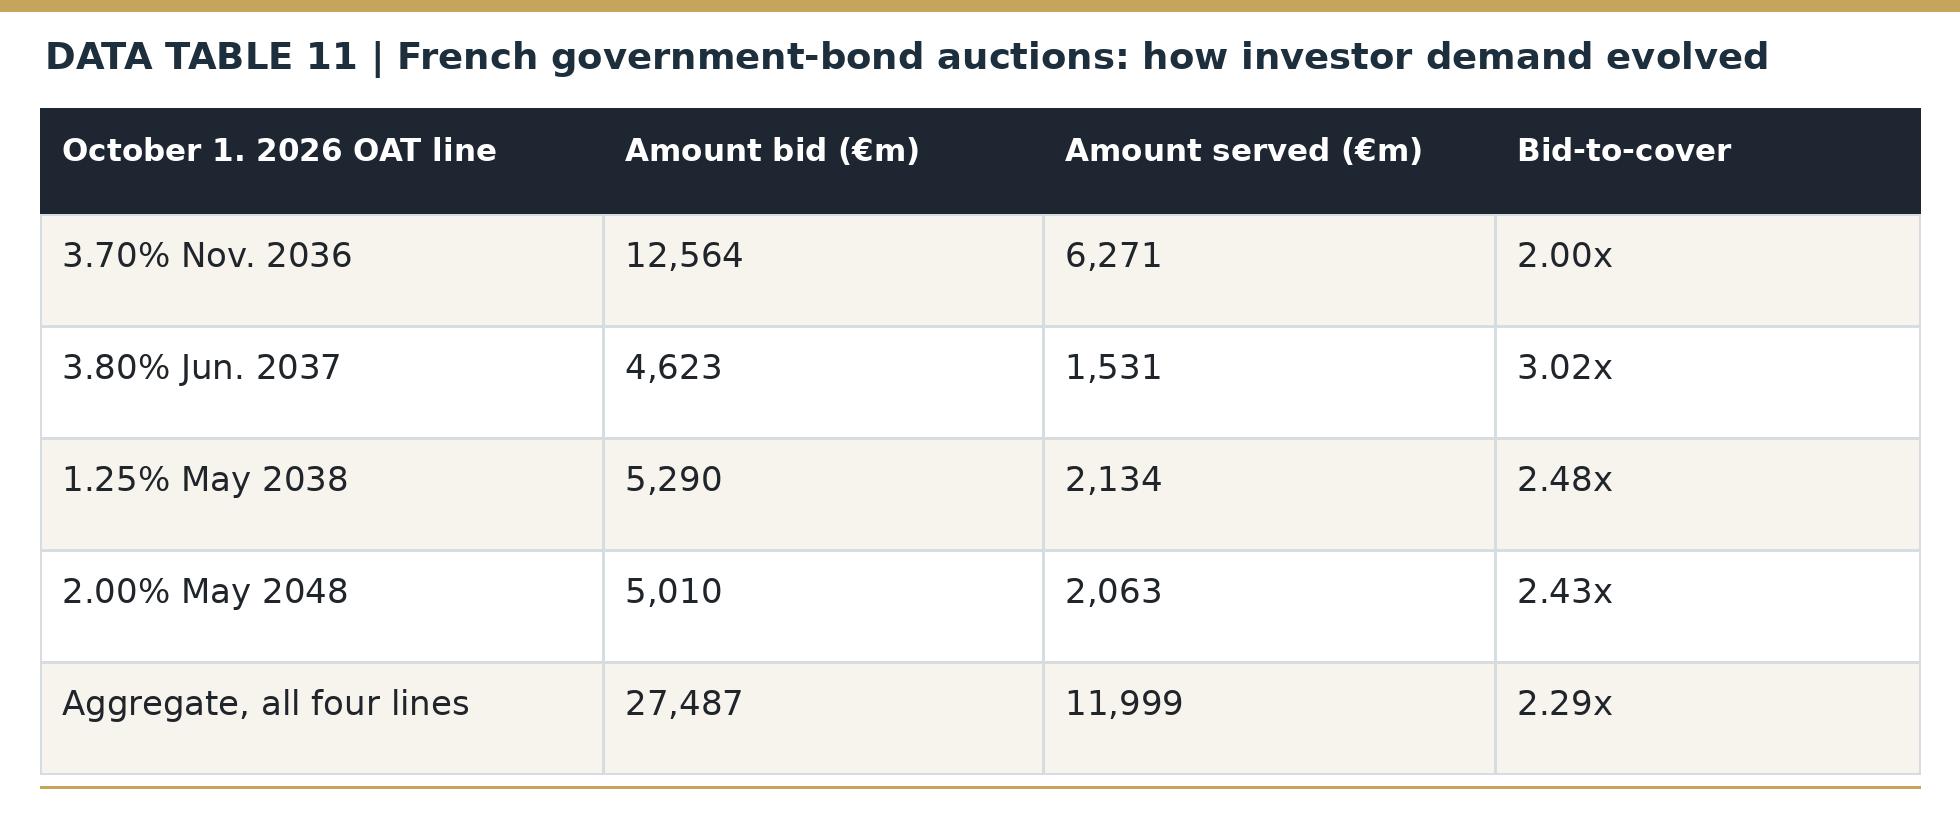
Table: demand coverage at ordinary OAT auctions, 2023–26. Aggregate bid-to-cover = total competitive bids divided by total allocations.
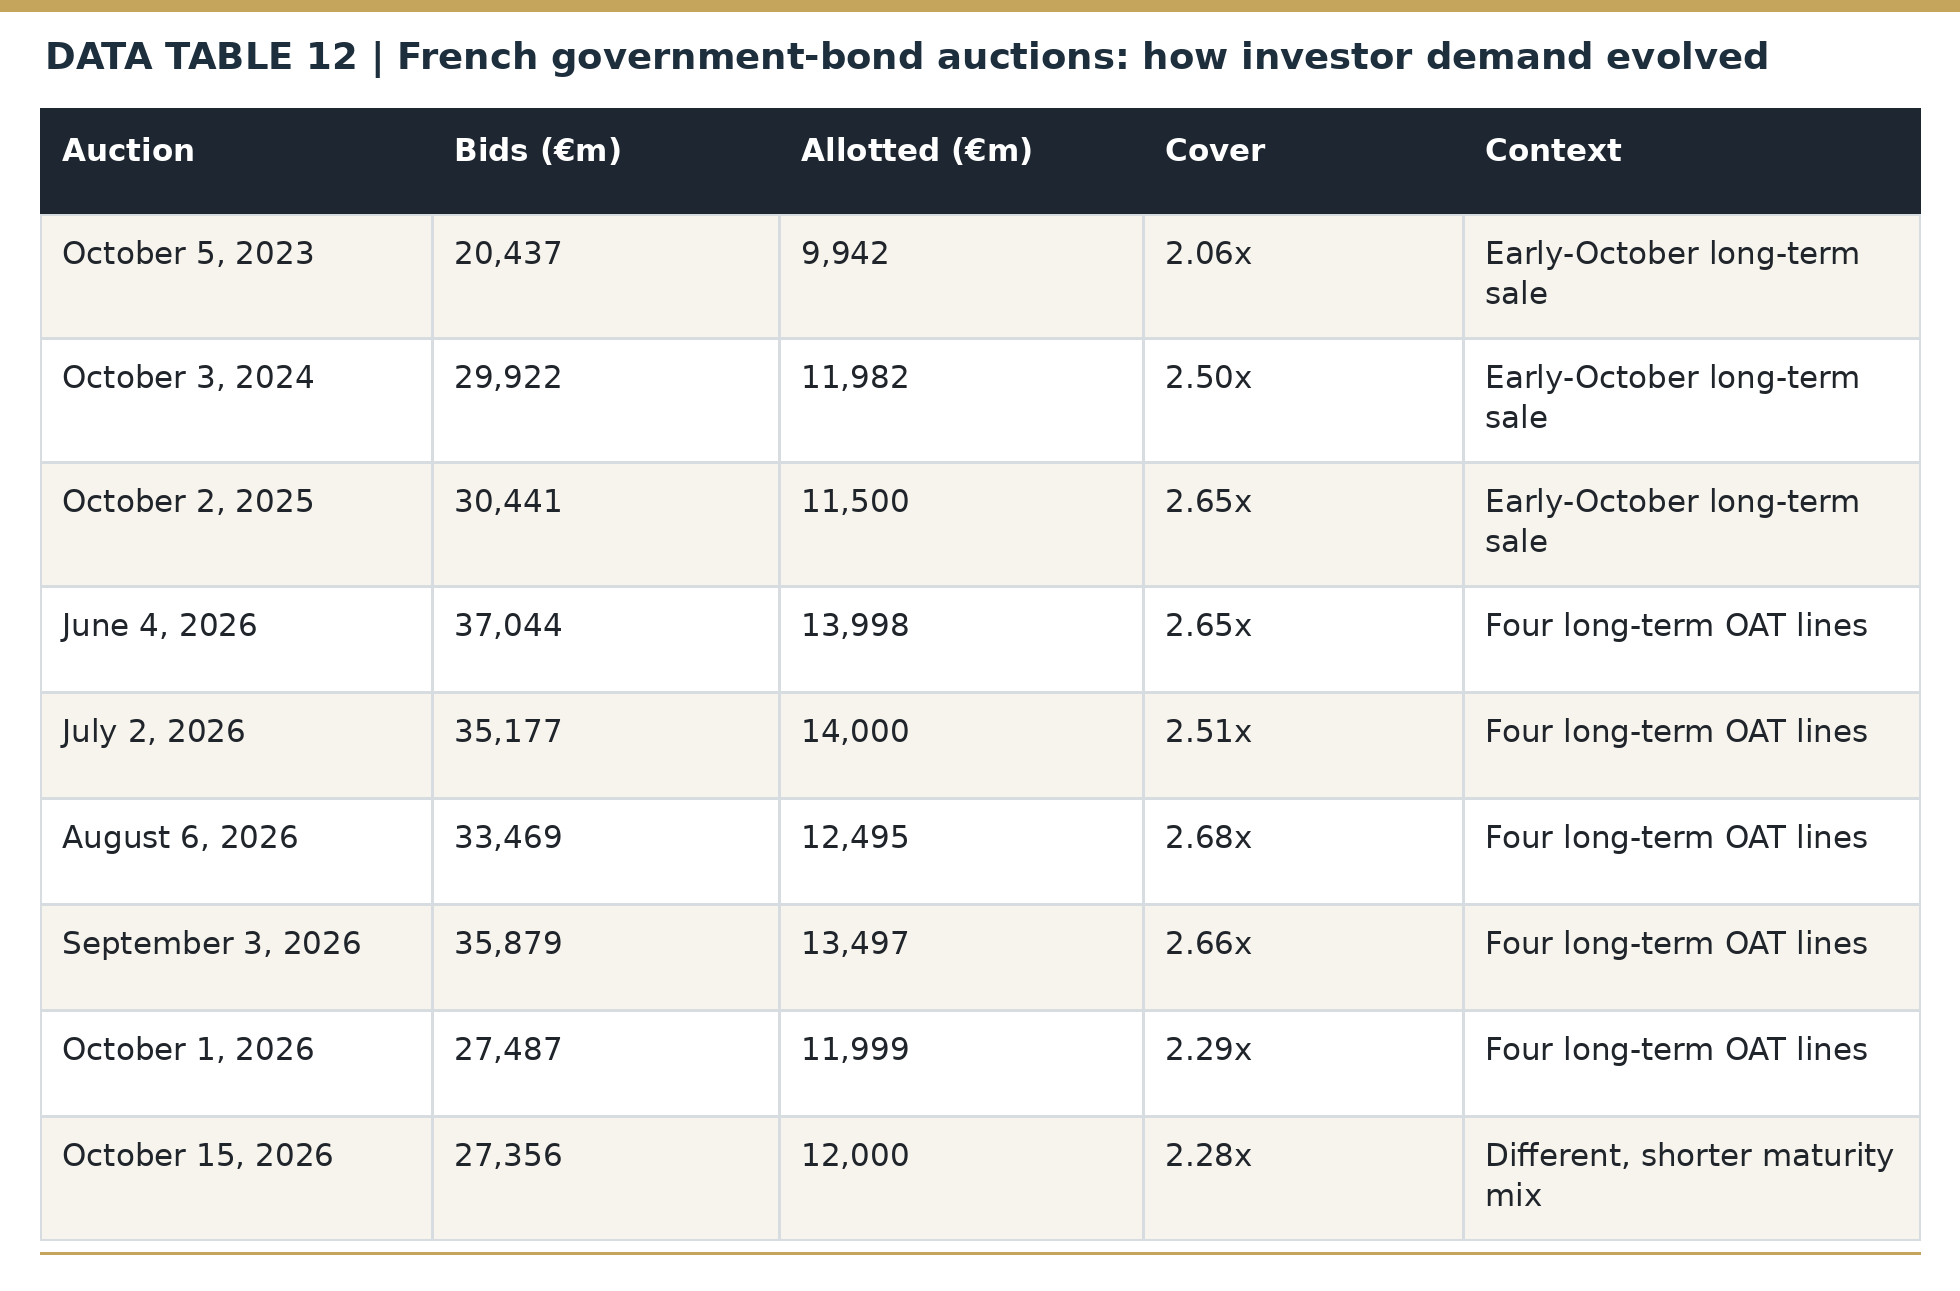
Figure 8. Bid-to-cover and issuance yield for the same November 2036 OAT across five successive auctions.
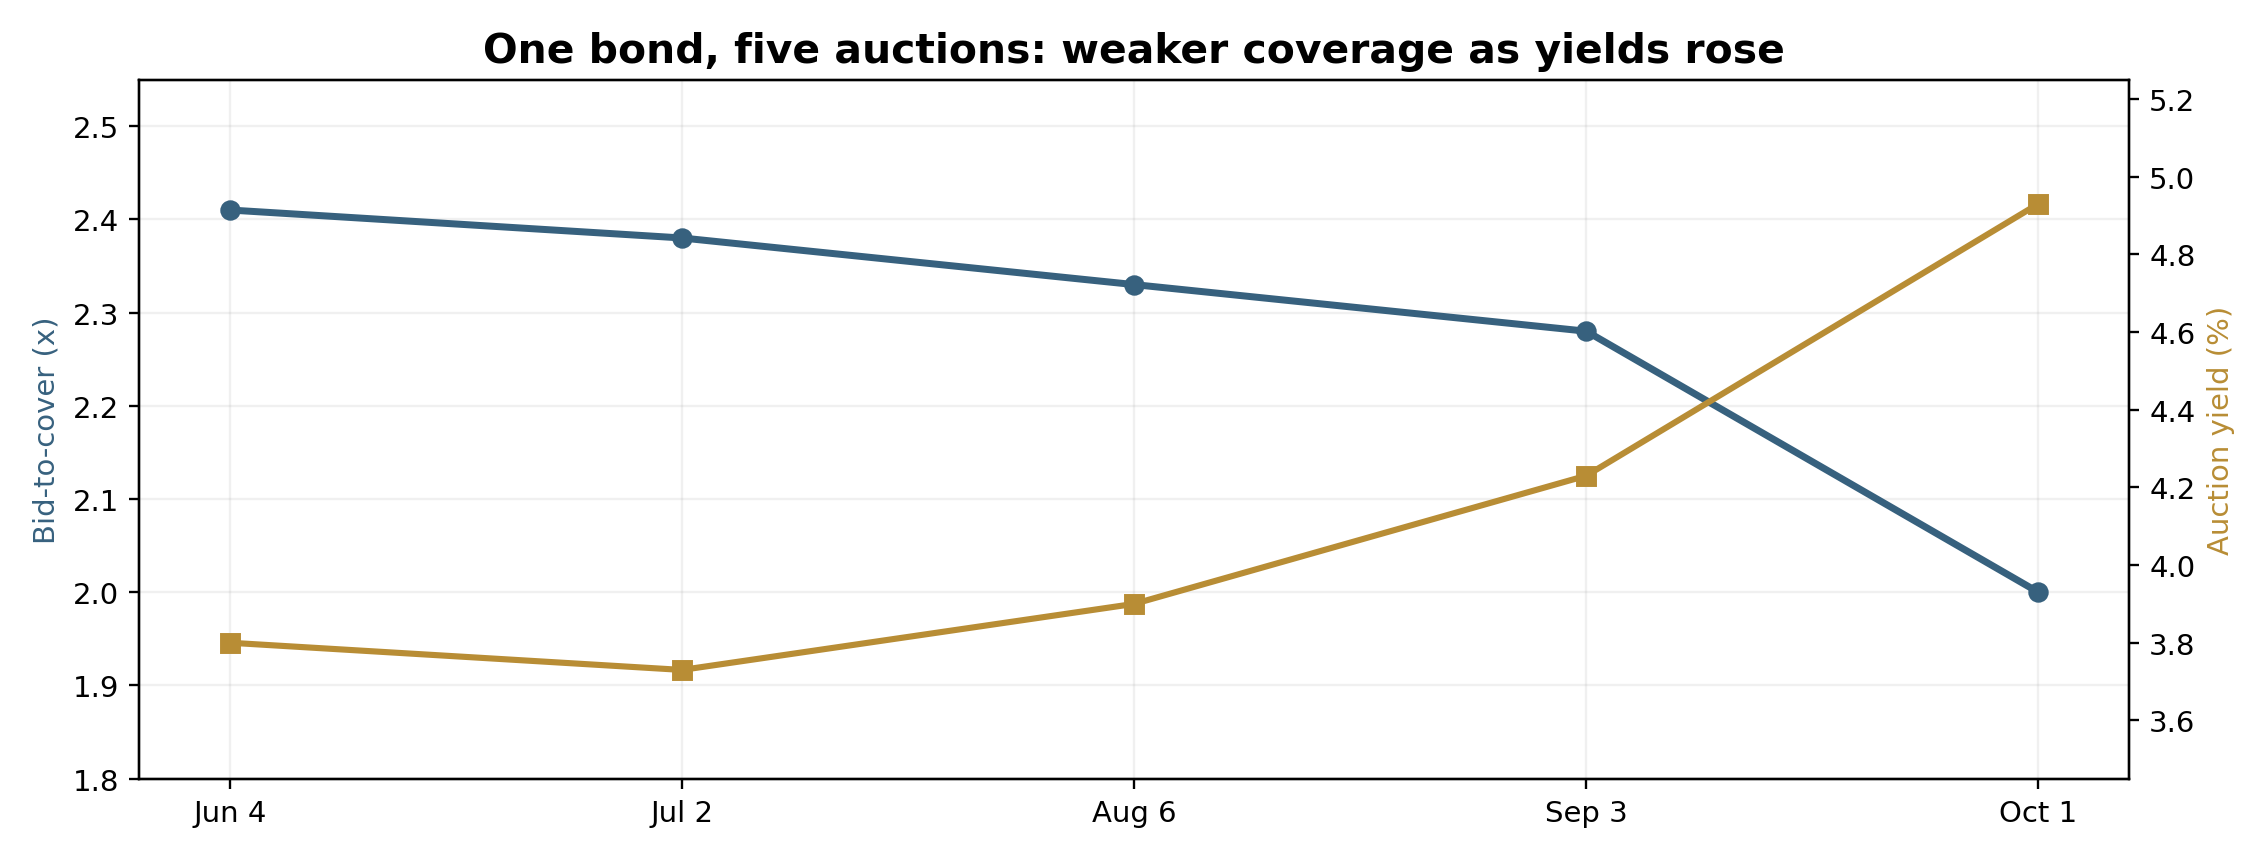
Source: official Agence France Trésor auction releases, June 4, July 2, August 6, September 3 and October 1, 2026. [2] [71] [74] [75]
Secondary-market conditions can be assessed with successive quoted bid–ask spreads, executable depth, trade counts or repo-market pricing. Publicly comparable transaction and order-book observations for the same French government bonds were unavailable for the full pre- and post-shock period. Auction coverage provides an independently reproducible primary-market demand test; the price series and their day-to-day changes document market stress but do not directly measure secondary liquidity. No French secondary-liquidity stage is inferred from an isolated venue trade count. [2] [54] [61]
The auction record shows progressively higher yields and weaker bid coverage for the same bond, while France continued funding itself. Direct evidence of a breakdown in secondary-market liquidity remains unavailable from the public sources checked; the analysis therefore treats that channel as an open monitoring question.
Six historical episodes chosen to test sovereign transmission across Europe
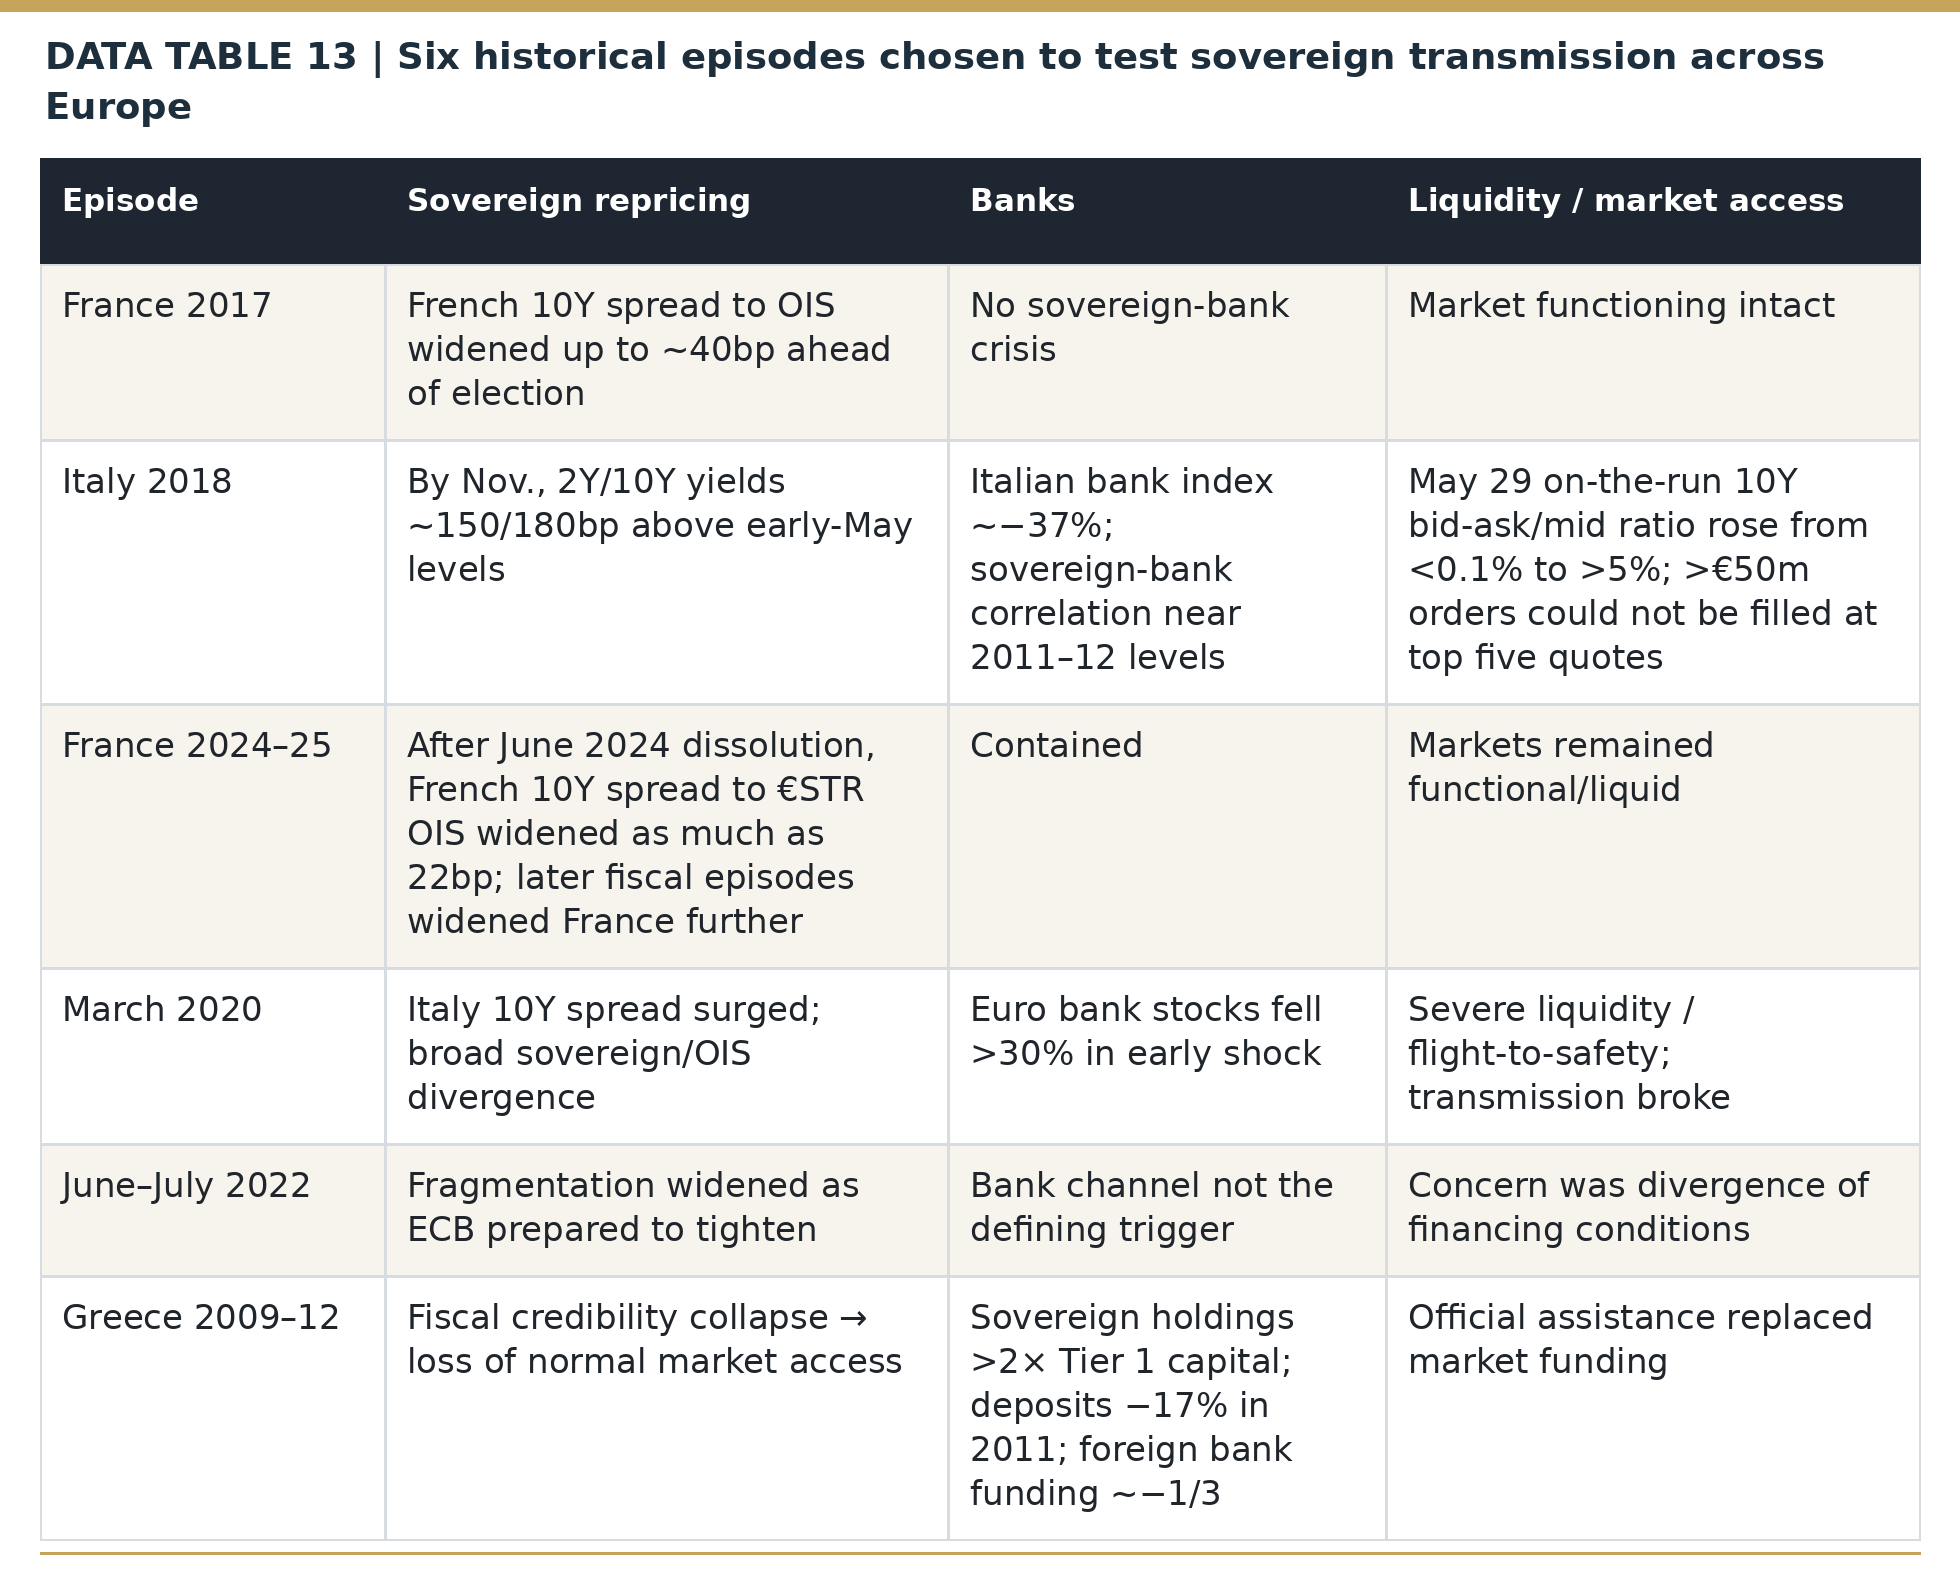
The historical comparisons span different levels of sovereign stress: France in 2017 and 2024–25 illustrate political repricing with limited spillovers; Italy in 2018 tests a sovereign–bank and liquidity link; March 2020 and June–July 2022 show market-wide dysfunction and central-bank responses; and Greece in 2009–12 shows how fiscal uncertainty can progress to market-access loss and restructuring. The same five dimensions are considered for each episode: government yields and CDS; banks and funding; bond-market functioning; euro exchange-rate or euro-integrity risk; and ECB or other official measures. This common structure makes the comparison useful for identifying mechanisms rather than assuming the crises were identical. [19] [20] [21] [22] [23] [24] [26] [27] [28] [29]
Panel A — sovereign, bank and market-functioning calibration
Panel B — FX/tail-risk and policy endpoints
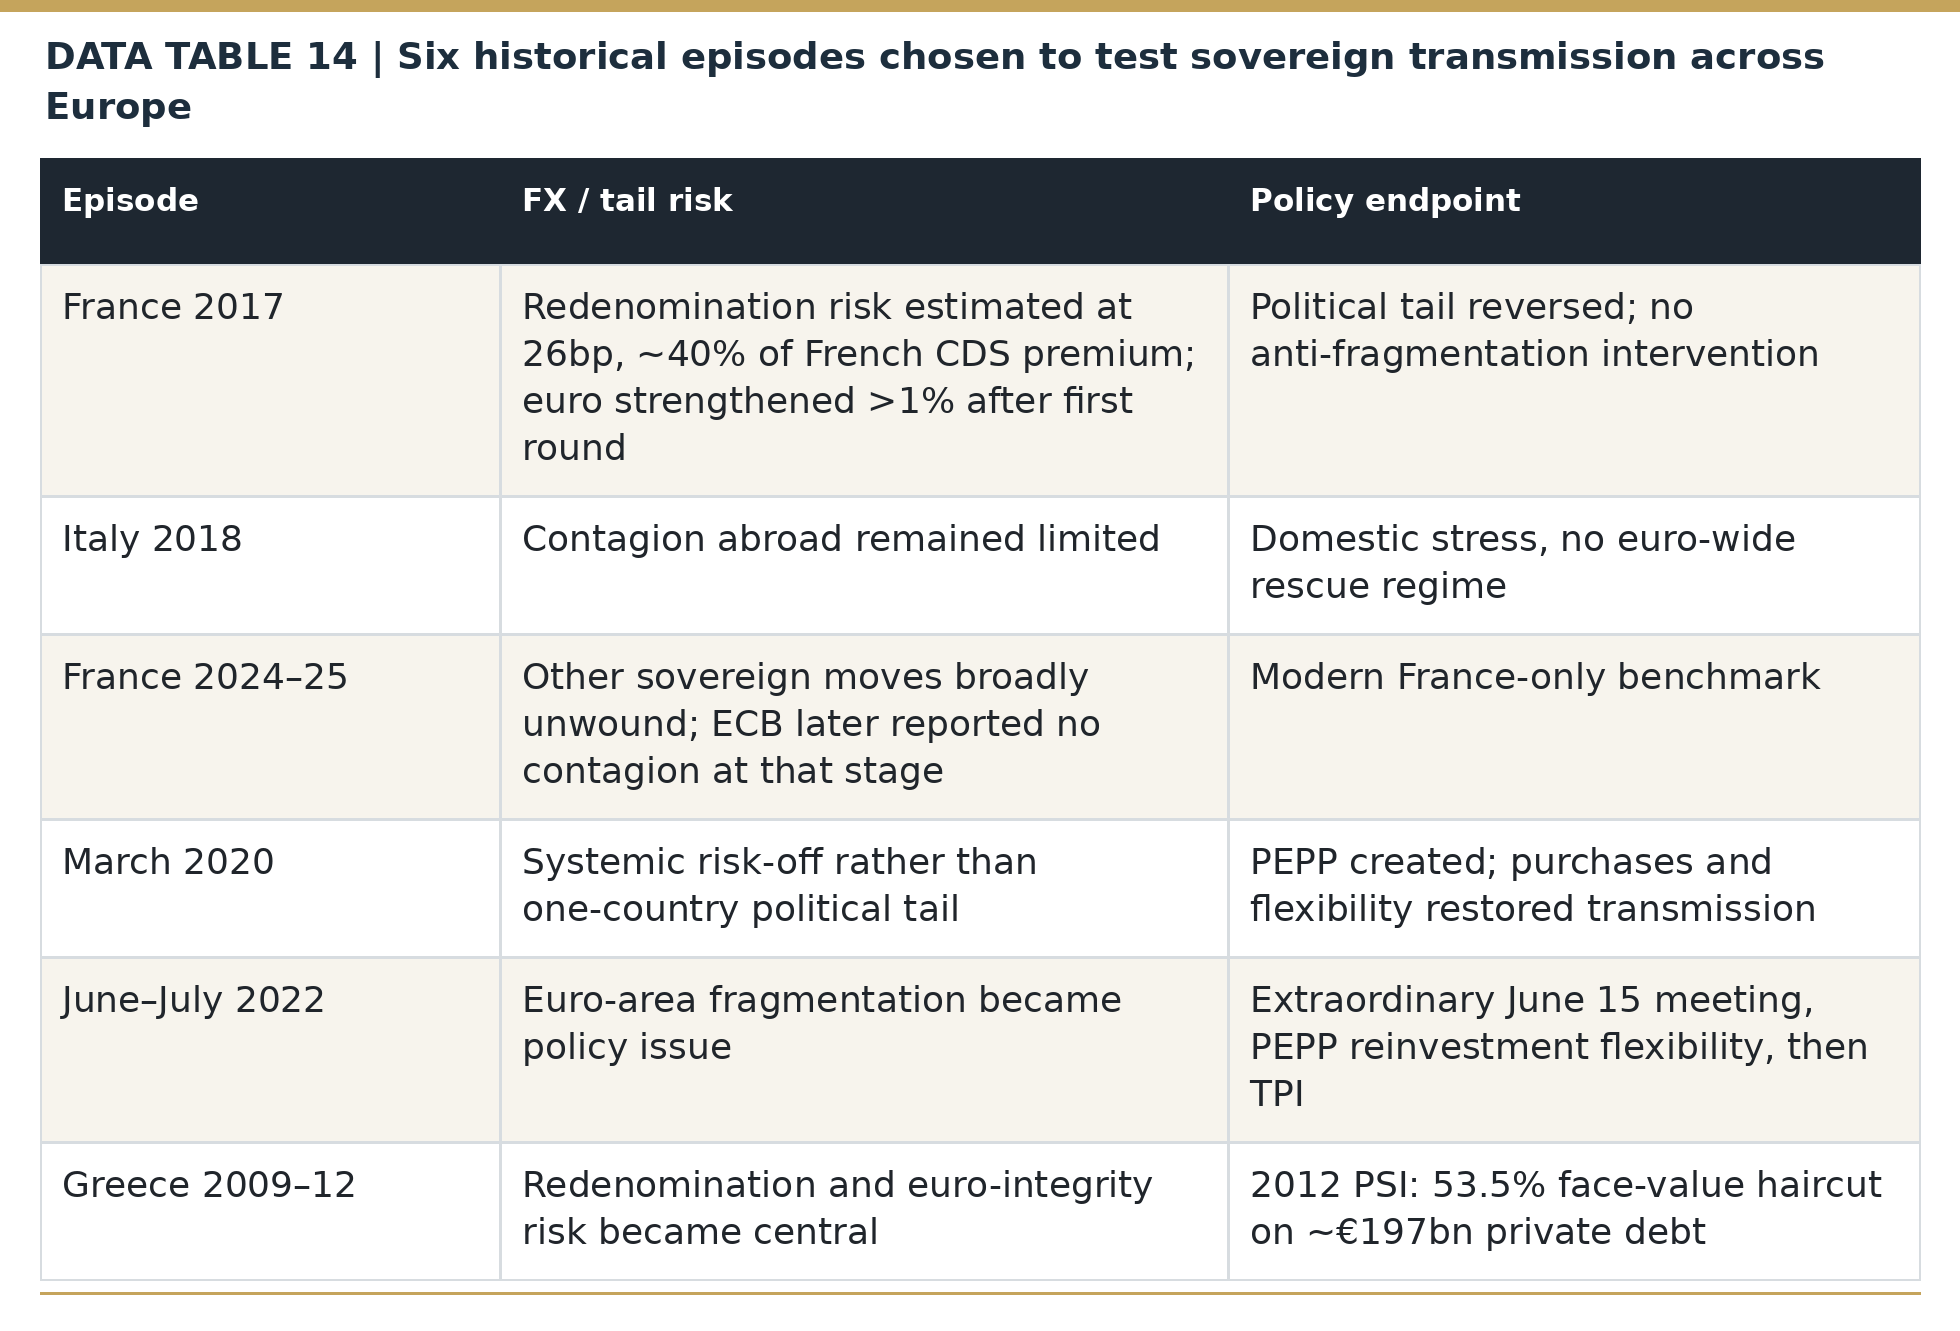
Sources and definitions for each historical episode are given in the References and Historical Data Notes. For Italy 2018, the ECB reports the Italian bank index down about 37% since early May and documents the May 29 deterioration in the on-the-run ten-year BTP: the bid-ask-spread-to-mid-price ratio rose from below 0.1% to above 5%, while orders above €50m could no longer be executed within the five best quotes. [21] [22]
France 2017: pricing the risk of currency redenomination
During France’s 2017 presidential race, investors were concerned that an exit from the euro area could convert some claims payable in euros into a new French currency. If that new currency depreciated, investors would lose value when converting payments back to euros, so the perceived risk increased the required sovereign credit premium. A peer-reviewed study by financial economist Lukas Kremens estimates this redenomination premium near 26bp in March 2017, or about 40% of the French sovereign CDS premium; it fell sharply after the election’s first round. [20]
The episode illustrates how euro-area institutional concerns can affect both credit prices and euro exchange rates. The current market evidence is interpreted using observed sovereign yields, CDS and dated news, without assigning an unsupported 2026 euro-exit premium.
Does France resemble an earlier stage of Greece?
Greece did not jump directly from a wide spread to restructuring. The sequence matters. In late 2009 fiscal-data credibility deteriorated and spreads began to rise. In spring 2010 market access failed and official assistance became necessary. In 2011 the sovereign shock was increasingly transmitted into banks and funding: deposits fell 17% and foreign bank funding fell roughly one-third. In 2012 private debt was restructured and redenomination risk became a system-level issue. [28] [29]
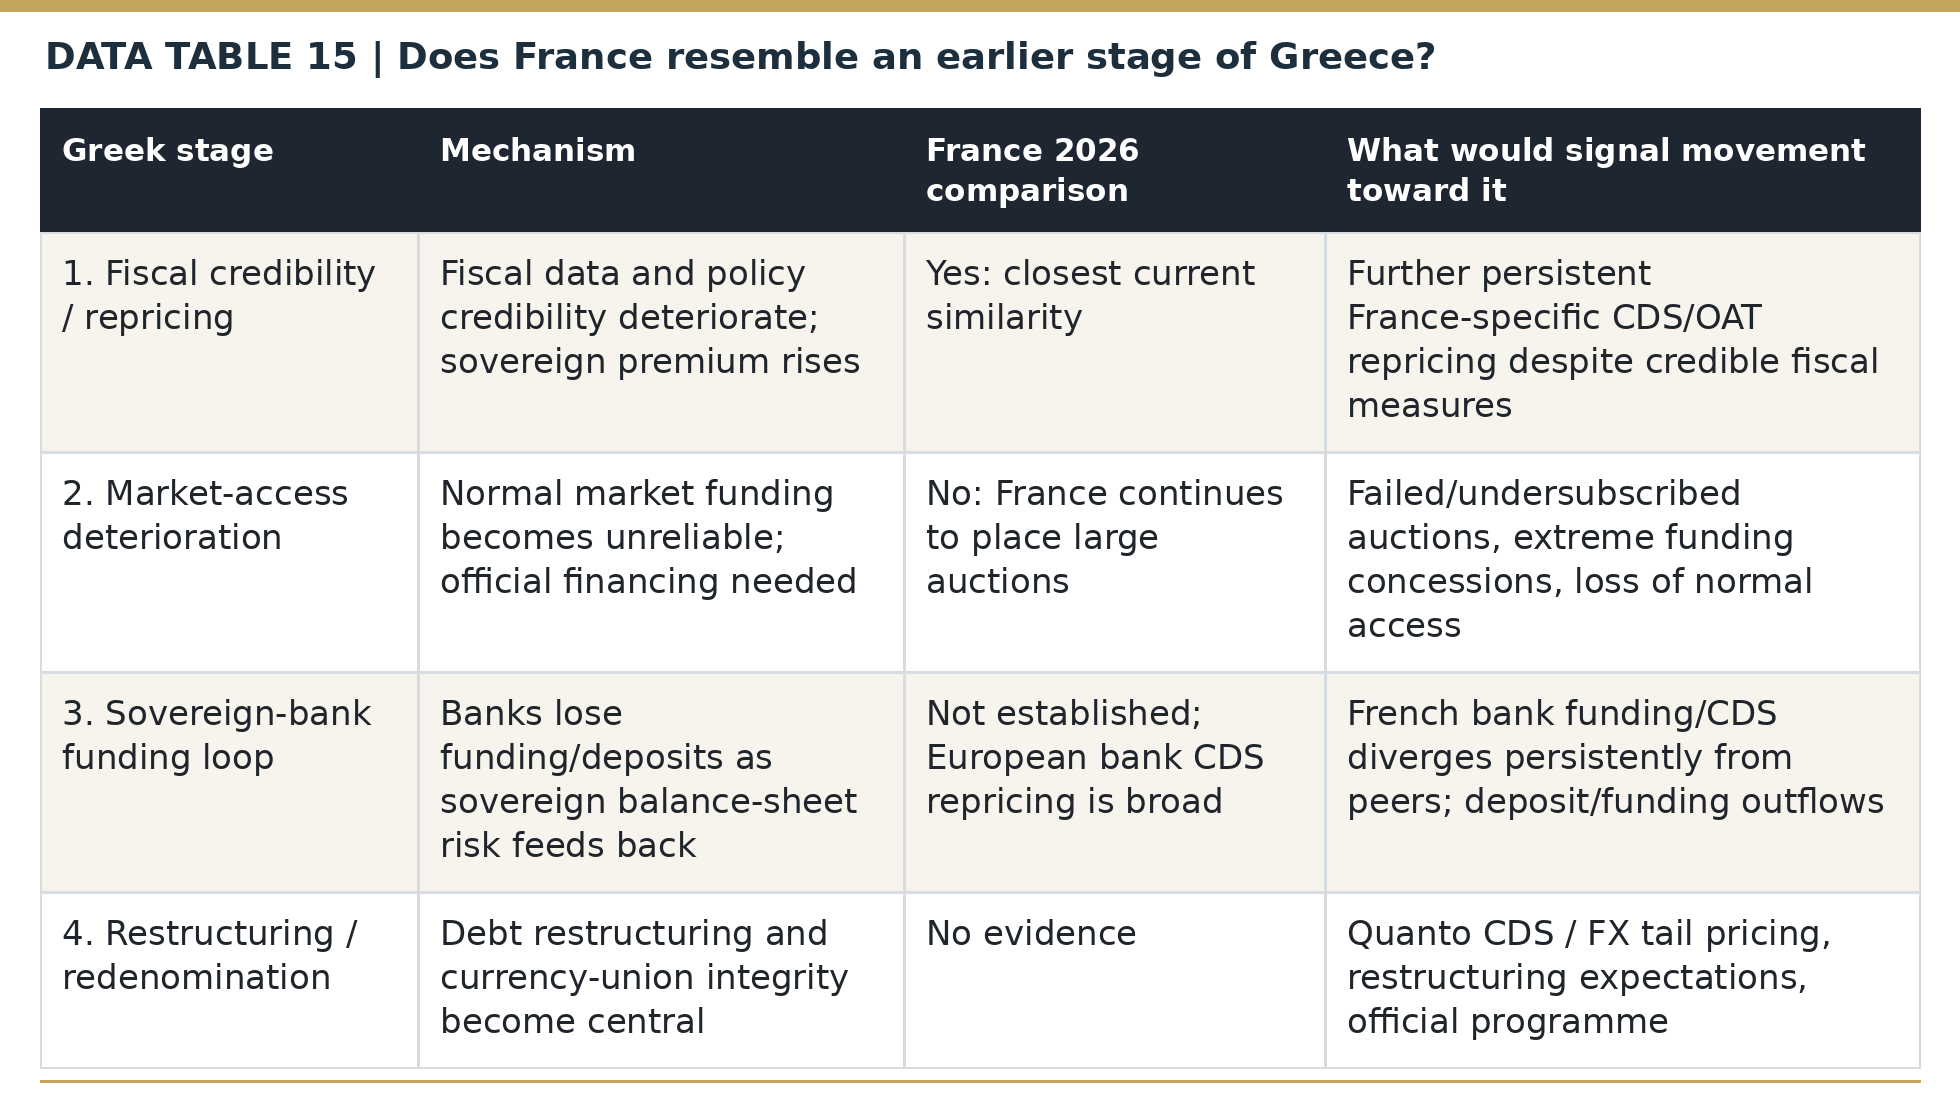
France therefore resembles only the earliest Greek stage in the generic sense that fiscal credibility has deteriorated and sovereign compensation has risen. That resemblance does not imply the same trajectory. France’s deeper market, longer debt maturity, diversified investor base, stronger banking system and different euro-area institutional architecture materially alter the transition probabilities. The useful question is not “is France Greece?” but whether any of the next Greek mechanisms begin to appear.
Policies that could slow or stop repricing and fragmentation: PEPP and TPI
The ECB’s historical pandemic bond-purchase programme (PEPP) and its Transmission Protection Instrument (TPI) illustrate two ways policy can stabilize stressed sovereign markets. Bond purchases may reduce disorderly selling and stabilize secondary-market pricing, while a credible backstop can lessen the incentive for forced deleveraging. Their use and eligibility are subject to the ECB’s assessment; neither instrument is designed to guarantee a particular French–German yield spread. [16] [26]
The Transmission Protection Instrument (TPI), announced in July 2022, is a different secondary-market tool aimed at unwarranted and disorderly financing divergence that threatens ECB policy transmission. Its potential impact is to lessen a self-reinforcing sale of sovereign bonds, bank funding stress and higher borrowing rates that no longer reflect fundamentals alone. TPI sets no numerical cap on the France–Germany spread; activation depends on the ECB’s assessment and country eligibility. France’s excessive-deficit status makes that eligibility politically and institutionally uncertain. [16] [18]
This is why the article monitors secondary-market liquidity, bank funding, private-credit conditions and the breadth of sovereign widening. Those are the channels through which a sovereign repricing becomes a transmission problem: if banks in one country face much higher funding costs, if corporate credit diverges sharply, or if liquidity breaks down, the same ECB policy rate no longer produces comparable financing conditions across the monetary union.
The ECB backstop cannot be assumed for France
TPI eligibility is an important constraint. The ECB’s published criteria include compliance with the EU fiscal framework. The wording is nuanced: a country should not be under an Excessive Deficit Procedure (EDP), or—if an EDP applies—not have been assessed as failing to take effective action under an EU Council recommendation. Fiscal sustainability and compliance with other EU recommendations are separate criteria. France is currently under an EDP. [16] [18]
Reuters reported on October 8 that euro-area officials did not view France as currently qualifying for intervention and emphasized the need for France to pass a credible budget. That means the backstop should not be treated as automatic. The official TPI wording leaves Governing Council discretion and the EDP criterion is not a simple one-line legal prohibition, but France’s fiscal status materially complicates eligibility. In a worsening tail scenario, that uncertainty raises risk relative to a framework that assumes the ECB would simply cap French spreads. [17]
A four-stage monitoring framework
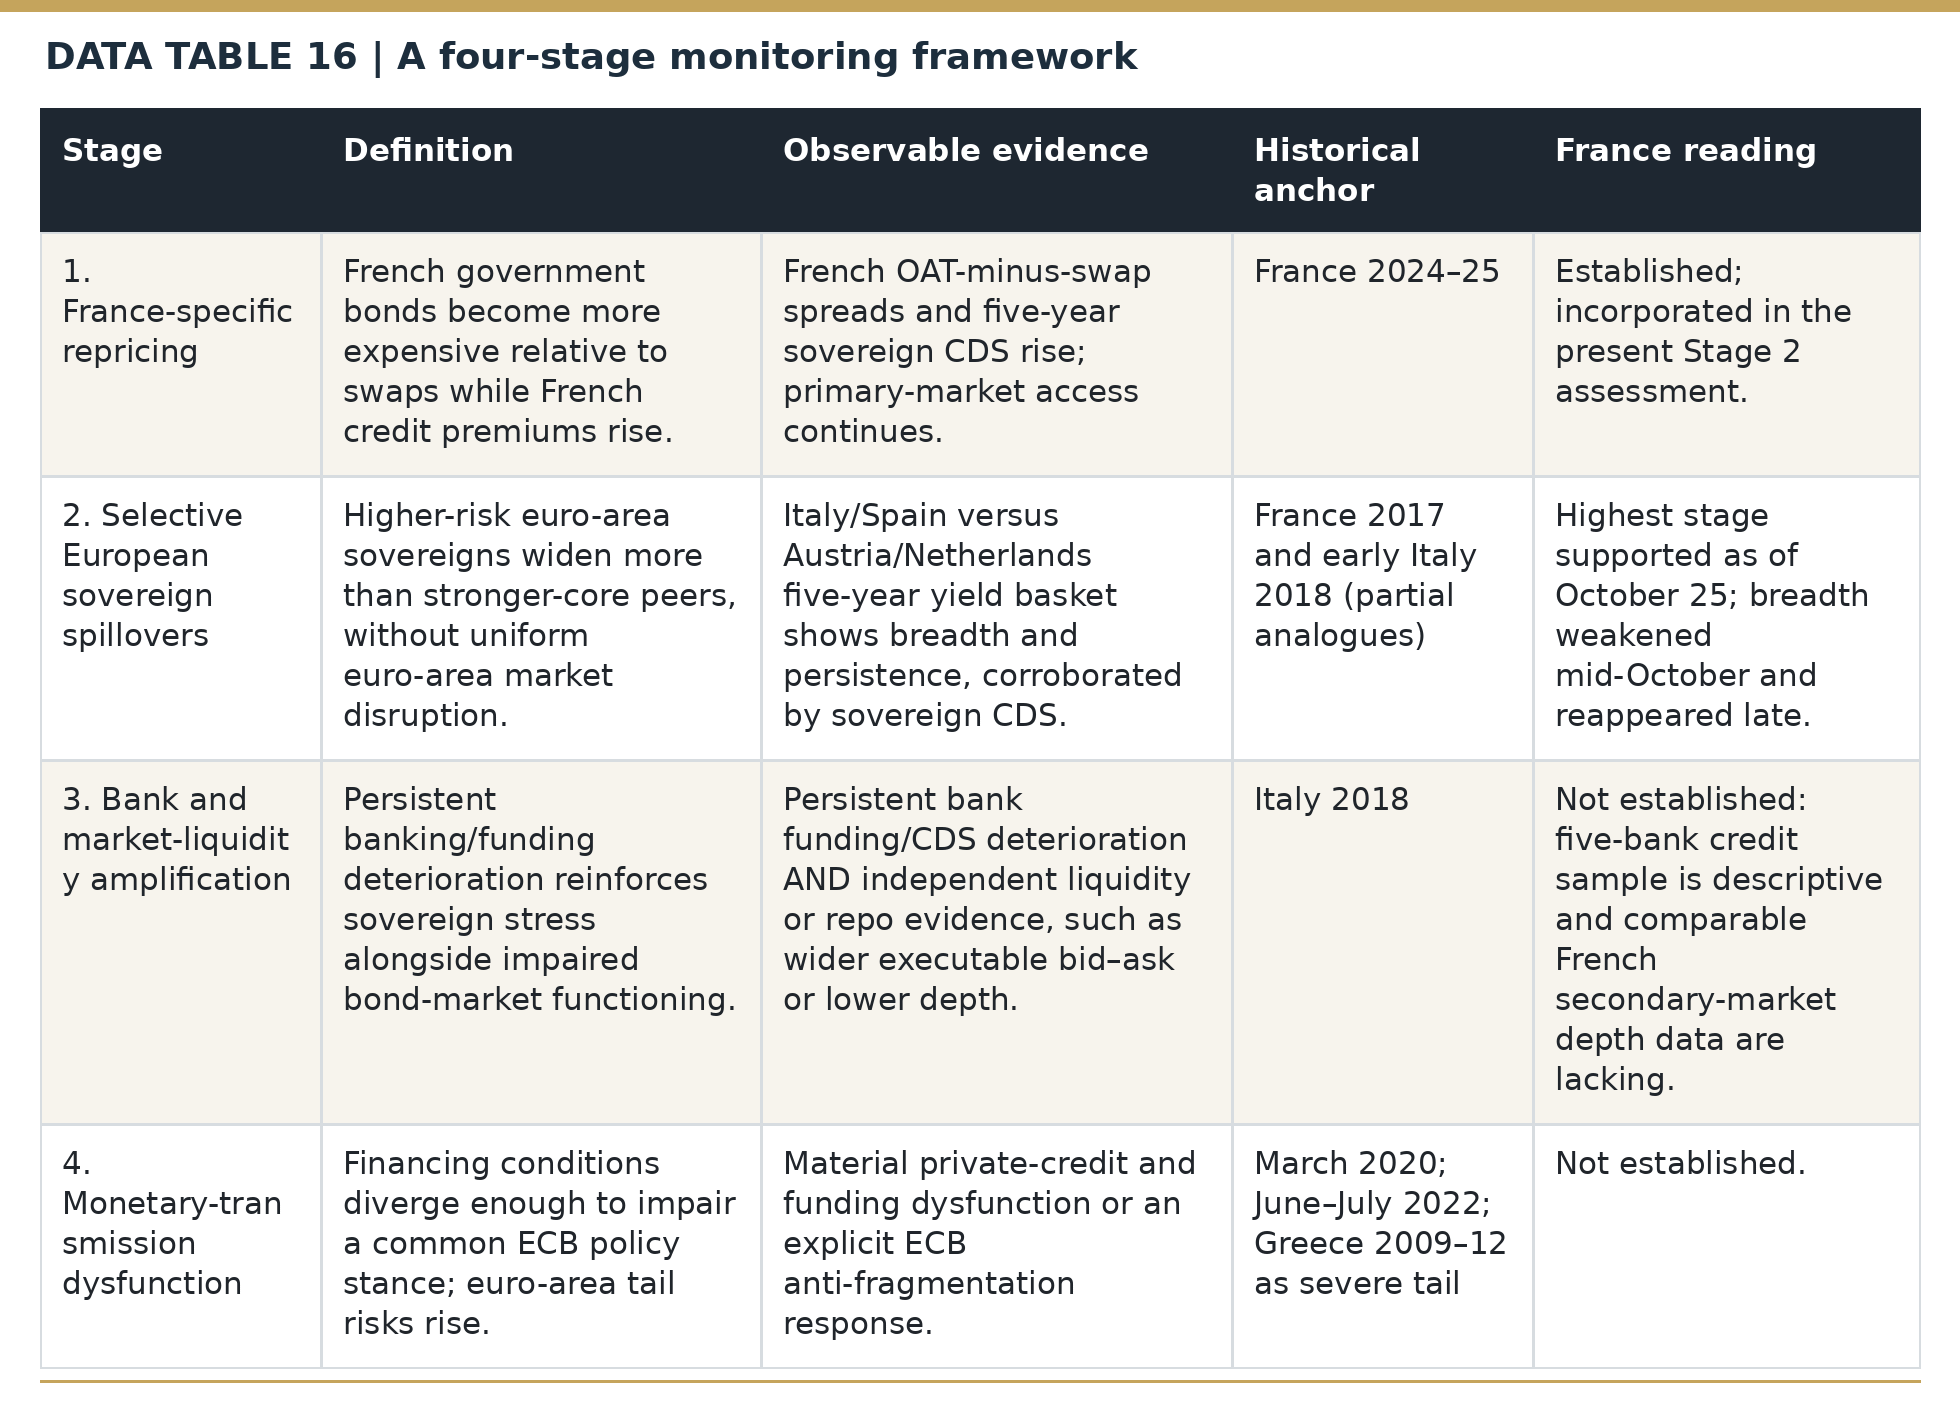
The four stages are: (1) France-specific repricing in government bonds and CDS; (2) selective widening in other European sovereigns; (3) bank-funding stress accompanied by impaired bond-market functioning; and (4) disruption of ECB monetary-policy transmission across the euro area. Historical episodes show mechanisms that can appear as crises intensify, although their timing and order vary. The stages are practical evidence gates drawn from market indicators and institutional experience. [15] [16] [19] [21] [26] [28]
Stage 1 is signaled by higher French government-yield premiums and CDS. Stage 2 requires corroborating changes for the predefined Italy/Spain relative to Austria/Netherlands group, observed in both bonds and sovereign CDS, with persistence over several sessions. Stage 3 requires sustained deterioration in bank funding as well as independent evidence from bond-market liquidity or repo conditions. Stage 4 requires material impairment of financing conditions across the currency union or an explicit ECB anti-fragmentation policy response. From October 7 to October 23, the four-country comparison passed four of eight five-day breadth checks, all late in the period. [9] [10] [35] [44] [49] [50] [51]
What the data say about the current stage as of October 25
Government-bond yields and foreign-exchange rates are available through Friday, October 23; the comparable sovereign-CDS series ends October 22. France’s 10-year bond spread over Germany reached about 168–172bp, while its five-year premium over swaps increased 31bp from October 7. Italy, Spain, Austria and the Netherlands continued to diverge selectively, although the four-country measure increased only 3.05bp on net during the later period. The late rise was predominantly French; Stage 2 remains the highest supported stage. [3] [4] [6] [8] [9] [10] [35] [44] [49] [50] [51]
Stage 3 requires a linked deterioration in banking credit or funding and tradable sovereign-market liquidity. BNP Paribas, Société Générale and Crédit Agricole together showed greater average CDS widening than UniCredit and Deutsche Bank, while repeated OAT auctions continued to attract bids. Due to limited public coverage of comparable secondary-market bid–ask, depth and repo series, that independent liquidity requirement cannot yet be evaluated robustly. Stage 3 is therefore unverified. [2] [11] [12] [13] [54] [72] [73]
Stage 4 is also unverified. France continued accessing government-bond auctions, and there is no documented ECB diagnosis of France-driven monetary-policy transmission failure. Moody’s retained Aa3 with a negative outlook on October 23 and linked its assessment to fiscal consolidation and political stability. Elevated French bond yields matter for debt service, but the observed evidence currently supports a sovereign-credit repricing with selective European spillovers. [1] [16] [62]
ECB-rate expectations reaction
Between October 7 and October 23, the five-year euro swap rate fell 5.3bp while the French five-year government yield rose 25.7bp. The ten-year swap declined 13.1bp while the French ten-year yield rose 15.9bp. This divergence shows the importance of sovereign compensation beyond common market interest rates. The euro exchange rate additionally reflects what investors expected about ECB decisions, US rates, inflation and global financial conditions before the news. [3] [5] [6] [8] [41] [68]
The ECB’s September 9–10 meeting account shows that the pre-shock discussion was already shaped by energy, inflation and global yields. On October 17, President Christine Lagarde said the subsequent global bond selloff had tightened financing conditions and was expected to slow growth and reduce the pass-through of cost pressures into inflation. Reuters linked the selloff to broader forces including higher oil prices associated with the Iran war and heavy credit demand related to AI investment; Lagarde did not identify France as the cause. This reinforces the need to separate France-specific sovereign stress from global financial-condition shocks in any FX attribution. [32] [34]
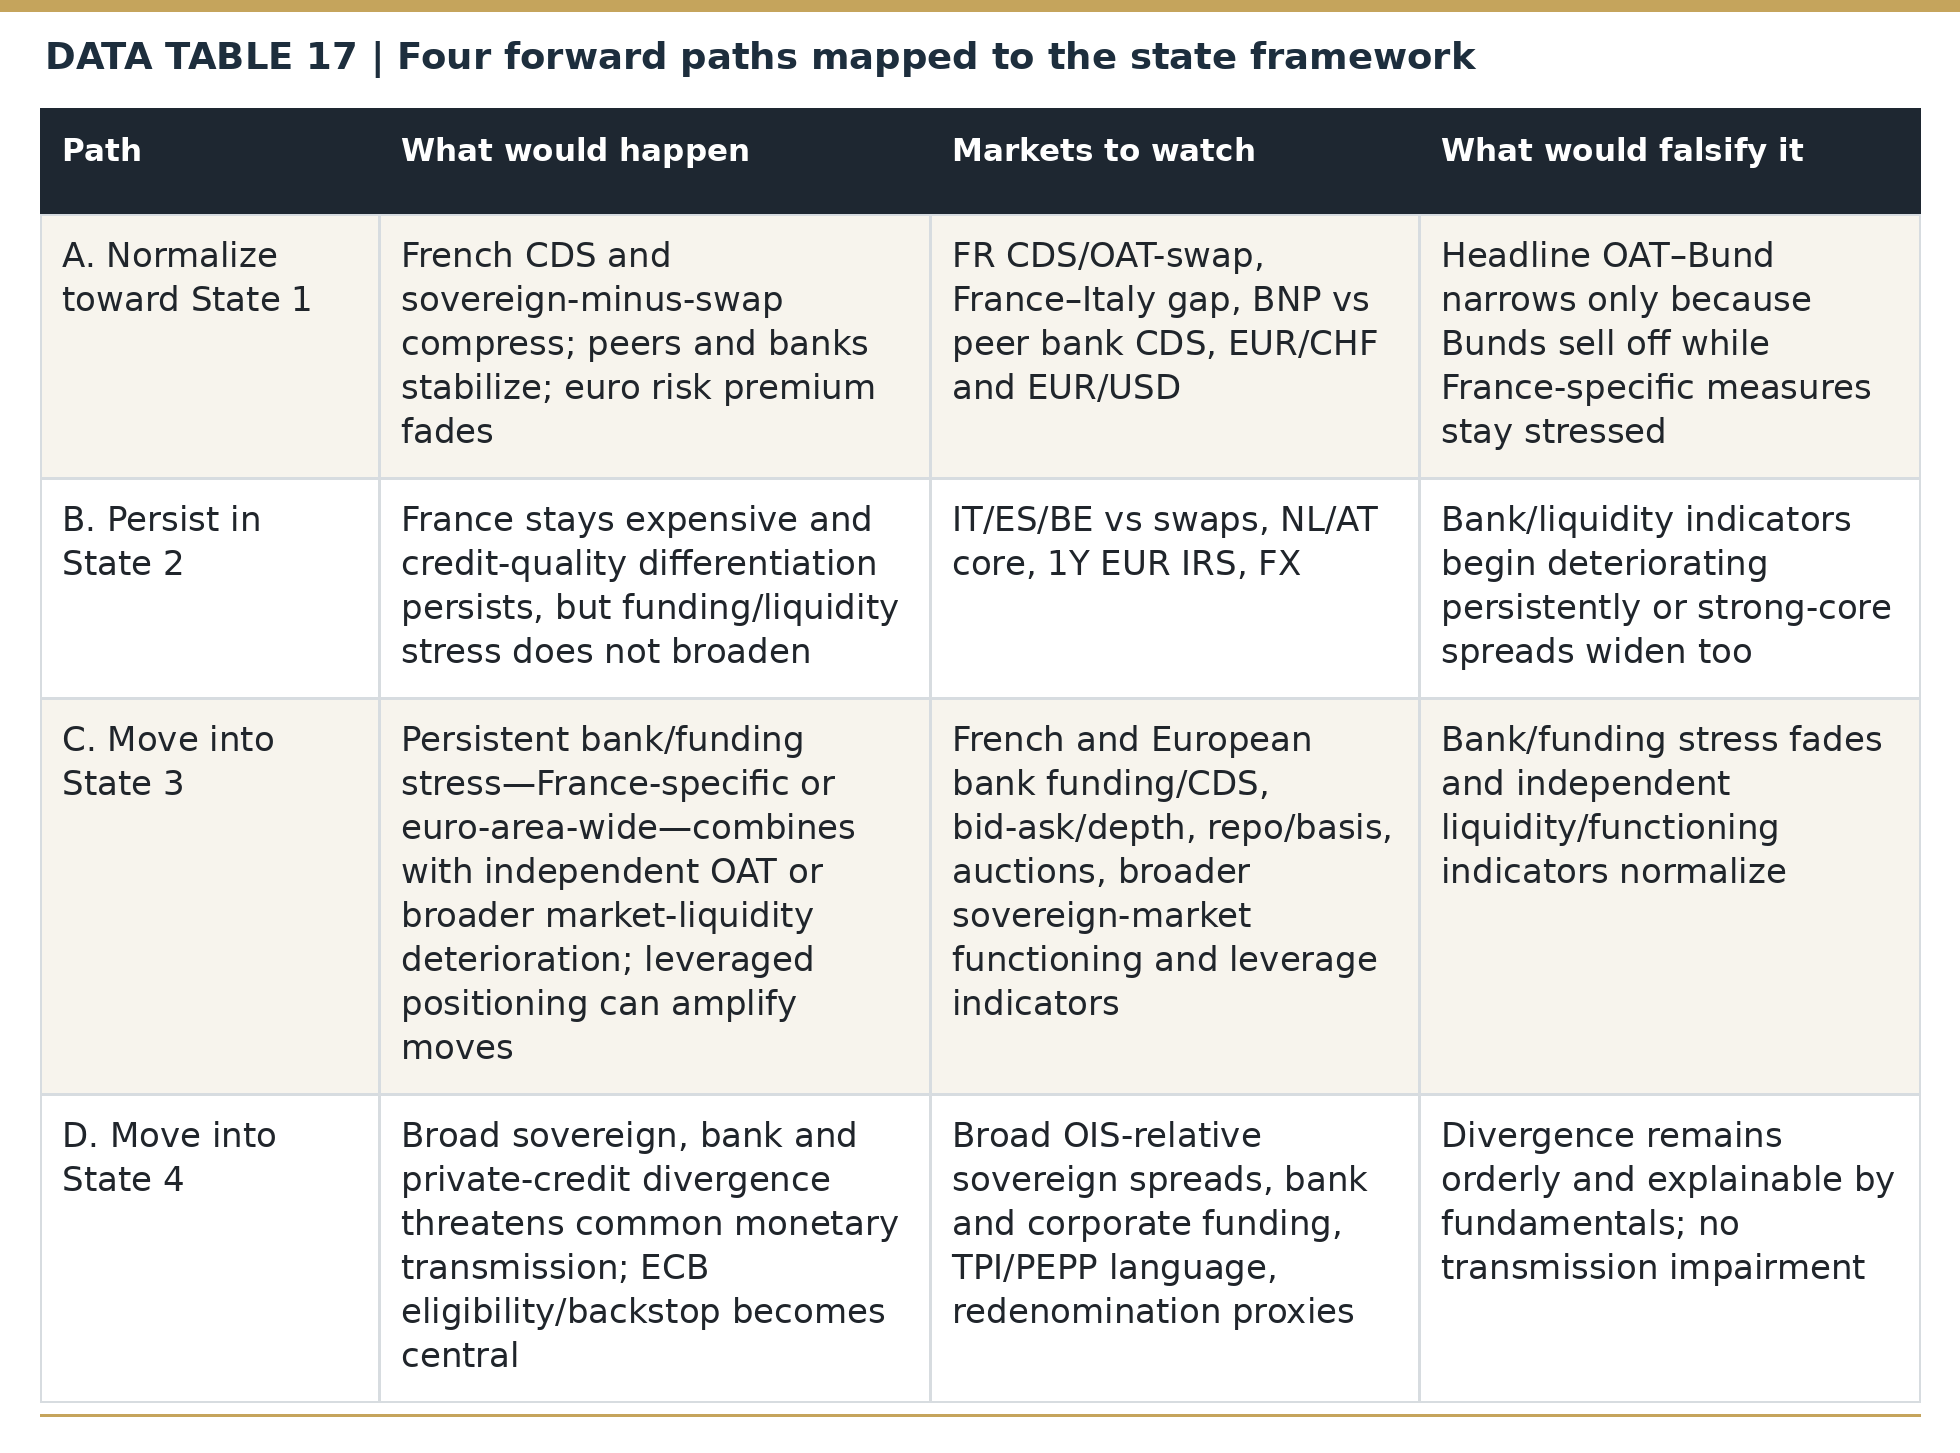
Four forward paths mapped to the state framework
Each forward path is conditional on verifiable developments, rather than assigned a probability from six historical cases. Normalization would involve falling France-specific swap-relative spreads and CDS as fiscal credibility improves. Persistent selective spillovers would keep weaker sovereigns relatively expensive without independent bank/liquidity damage. A more serious path would show broad bank funding stress together with wider executable bid–ask spreads, falling depth or impaired repo trading. A systemic path would show disruption of cross-country private credit or an ECB diagnosis of monetary-transmission impairment. The measurable signs—and evidence that could disprove each path—are summarized in the table.
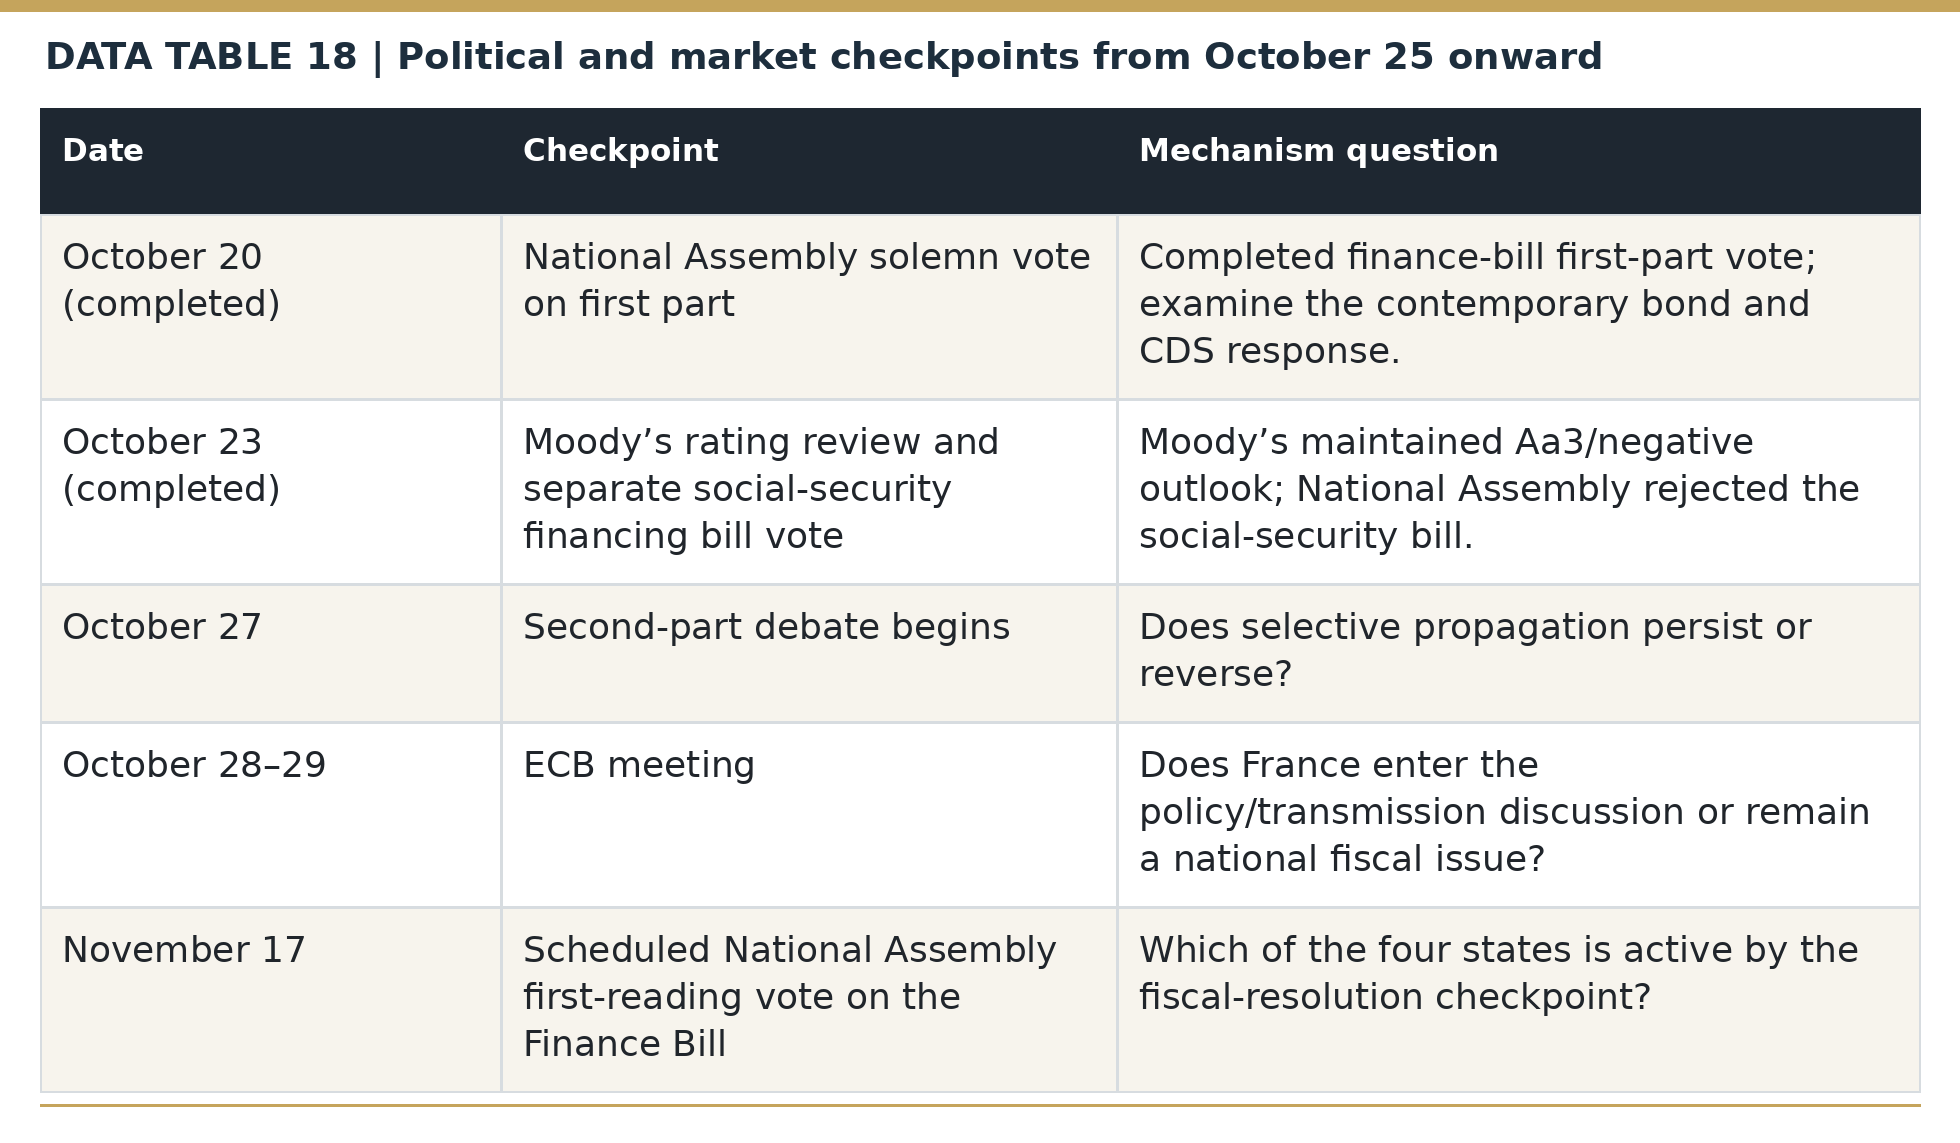
Political and market checkpoints from October 25 onward
By October 25, the National Assembly had rejected the 2027 Social Security Financing Bill at first reading, and Moody’s had maintained France’s Aa3 credit rating with a negative outlook. The Social Security Financing Bill is separate from the central-government Finance Bill. The next scheduled tests concern the latter’s budget debate, the October 28–29 ECB meeting and the National Assembly’s November 17 first-reading budget vote. The latest available bond and ECB exchange-rate closes remain dated October 23 because financial markets are closed over the weekend. [30] [62] [63]
Conclusion
France’s 10-year borrowing yield was roughly 5.03%–5.05% on October 23, with a spread over Germany near 168–172bp. The repricing reflects an inherited stock of public debt, recurring deficits and repeated political obstacles to fiscal adjustment; changing global interest-rate and energy conditions can raise the cost of financing further. Moody’s decision to maintain Aa3 with a negative outlook confirms the importance of the next fiscal decisions. [3] [4] [46] [52] [53] [55] [56] [62]
The ten-year French–German yield gap widened 29.61bp between October 7 and October 23, with 29.00bp measured on the French side of a common euro swap curve. Credit-risk insurance on French government debt widened more than Italy’s and Spain’s, while the stronger-core versus higher-risk peer gap widened just 3.05bp on net during the same late phase. France led the latest sovereign repricing, while broader spillovers were selective and intermittent. [3] [4] [5] [6] [7] [8] [10] [35] [44] [49] [50] [51]
The euro exchange rate behaved differently against the dollar and Swiss franc: EUR/USD increased 0.14% from October 7 to October 23, while EUR/CHF declined 0.88%. Investors were simultaneously evaluating ECB, US and Swiss rates, energy prices, risk sentiment and portfolio demand. The historical coefficients are unstable, making event-specific news and expectations more informative than any permanent France–exchange-rate sensitivity. [41] [68]
The average three-bank French CDS increase from October 2 to October 22–23 exceeded that of two foreign comparator banks. France also continued placing government debt at auction, albeit with weaker bid-to-cover on the repeatedly reopened 2036 bond and on aggregate in early October. We have been unable to verify consistent pre- and post-shock executable bond-market bid–ask spreads or depth from public sources. These findings support closer attention to bank funding and market functioning while leaving Stage 3 unverified. [2] [11] [12] [13] [54] [72] [73] [74] [75]
The October 23 rejection of the social-security financing bill shows how parliamentary disagreements can impede fiscal consolidation. The central-government Finance Bill remains a separate test. France’s fiscal adjustment and its effects on borrowing costs, banks and the euro exchange rate now depend on the credibility of subsequent political decisions. [62] [63]
The most consequential next signal is whether France’s sovereign premium begins to compress with credible budget progress—or whether higher funding costs spread into banks, sovereign-market functioning and private borrowing conditions.
Methods, data definitions and reproducibility
A1. Main sovereign decomposition
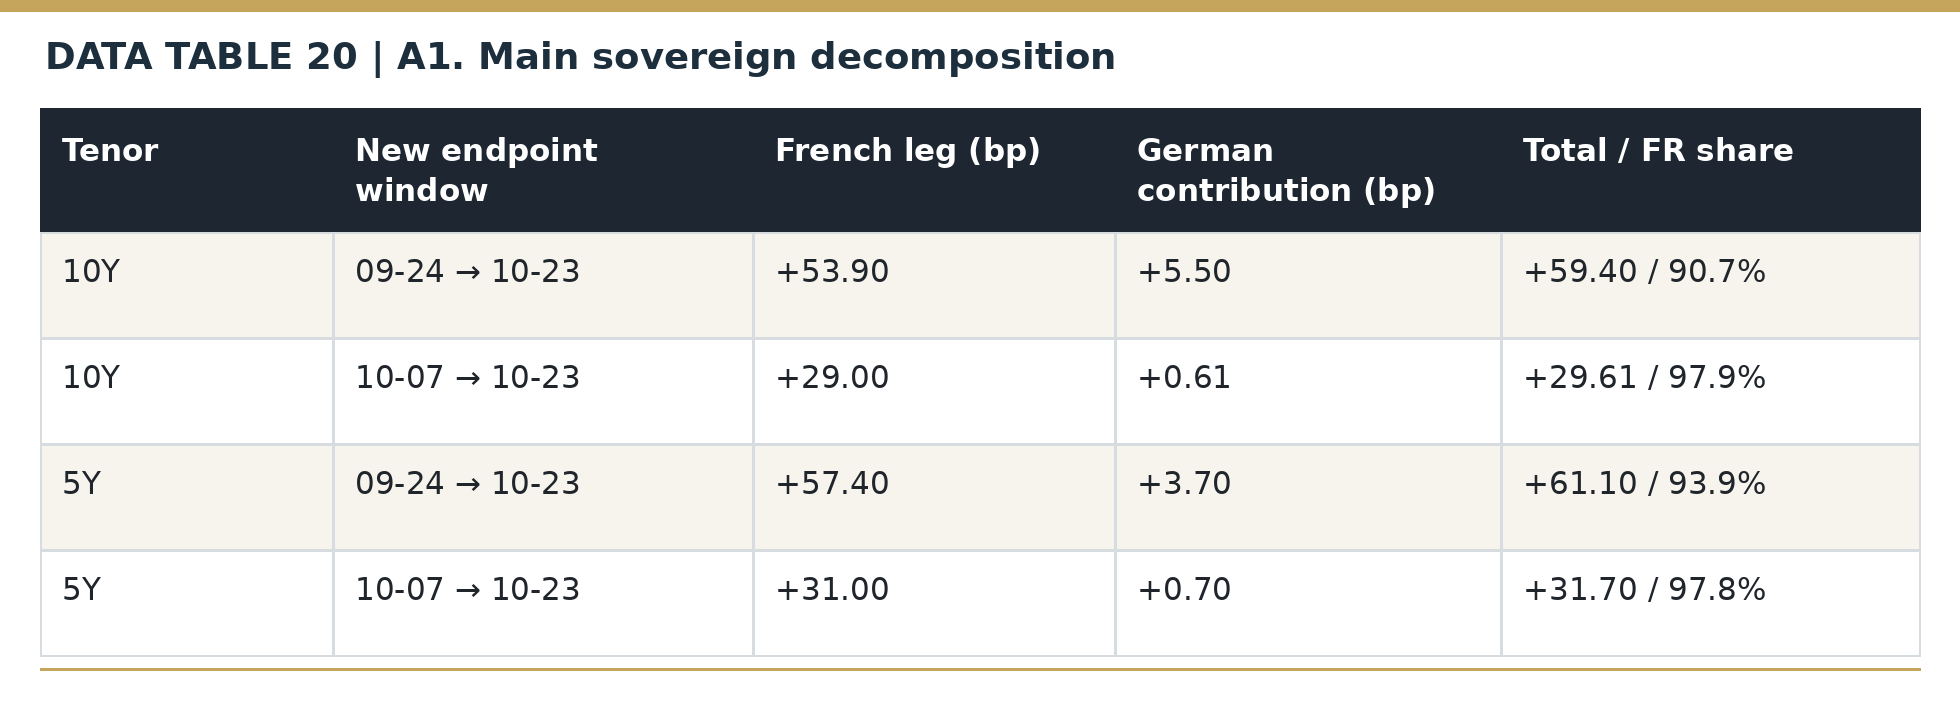
The sovereign accounting identity is evaluated with published five- and ten-year French/German government yields and same-tenor Euribor-linked euro swaps. For September 24–October 23, the ten-year gap widened 59.40bp, of which 53.90bp was associated with the French-minus-swap leg; for October 7–23, the gap widened 29.61bp, of which 29.00bp was on the French leg. Five-year totals were 61.10bp and 31.70bp, respectively. These are daily-closing-price calculations, with independently timed quotations. [3] [4] [5] [6] [7] [8]



The exact identity Δ(FR−DE)=Δ(FR−IRS)−Δ(DE−IRS) separates the two relative yield changes. September 24–October 23: ten-year France +53.90bp and Germany +5.50bp, total +59.40bp (French share 90.7%). October 7–23: France +29.00bp and Germany +0.61bp, total +29.61bp (French share 97.9%). Five-year changes are respectively +57.40bp/+3.70bp and +31.00bp/+0.70bp. Since the IRS references six-month Euribor, the percentage allocations depend on the chosen common benchmark. [3] [4] [5] [6] [7] [8]
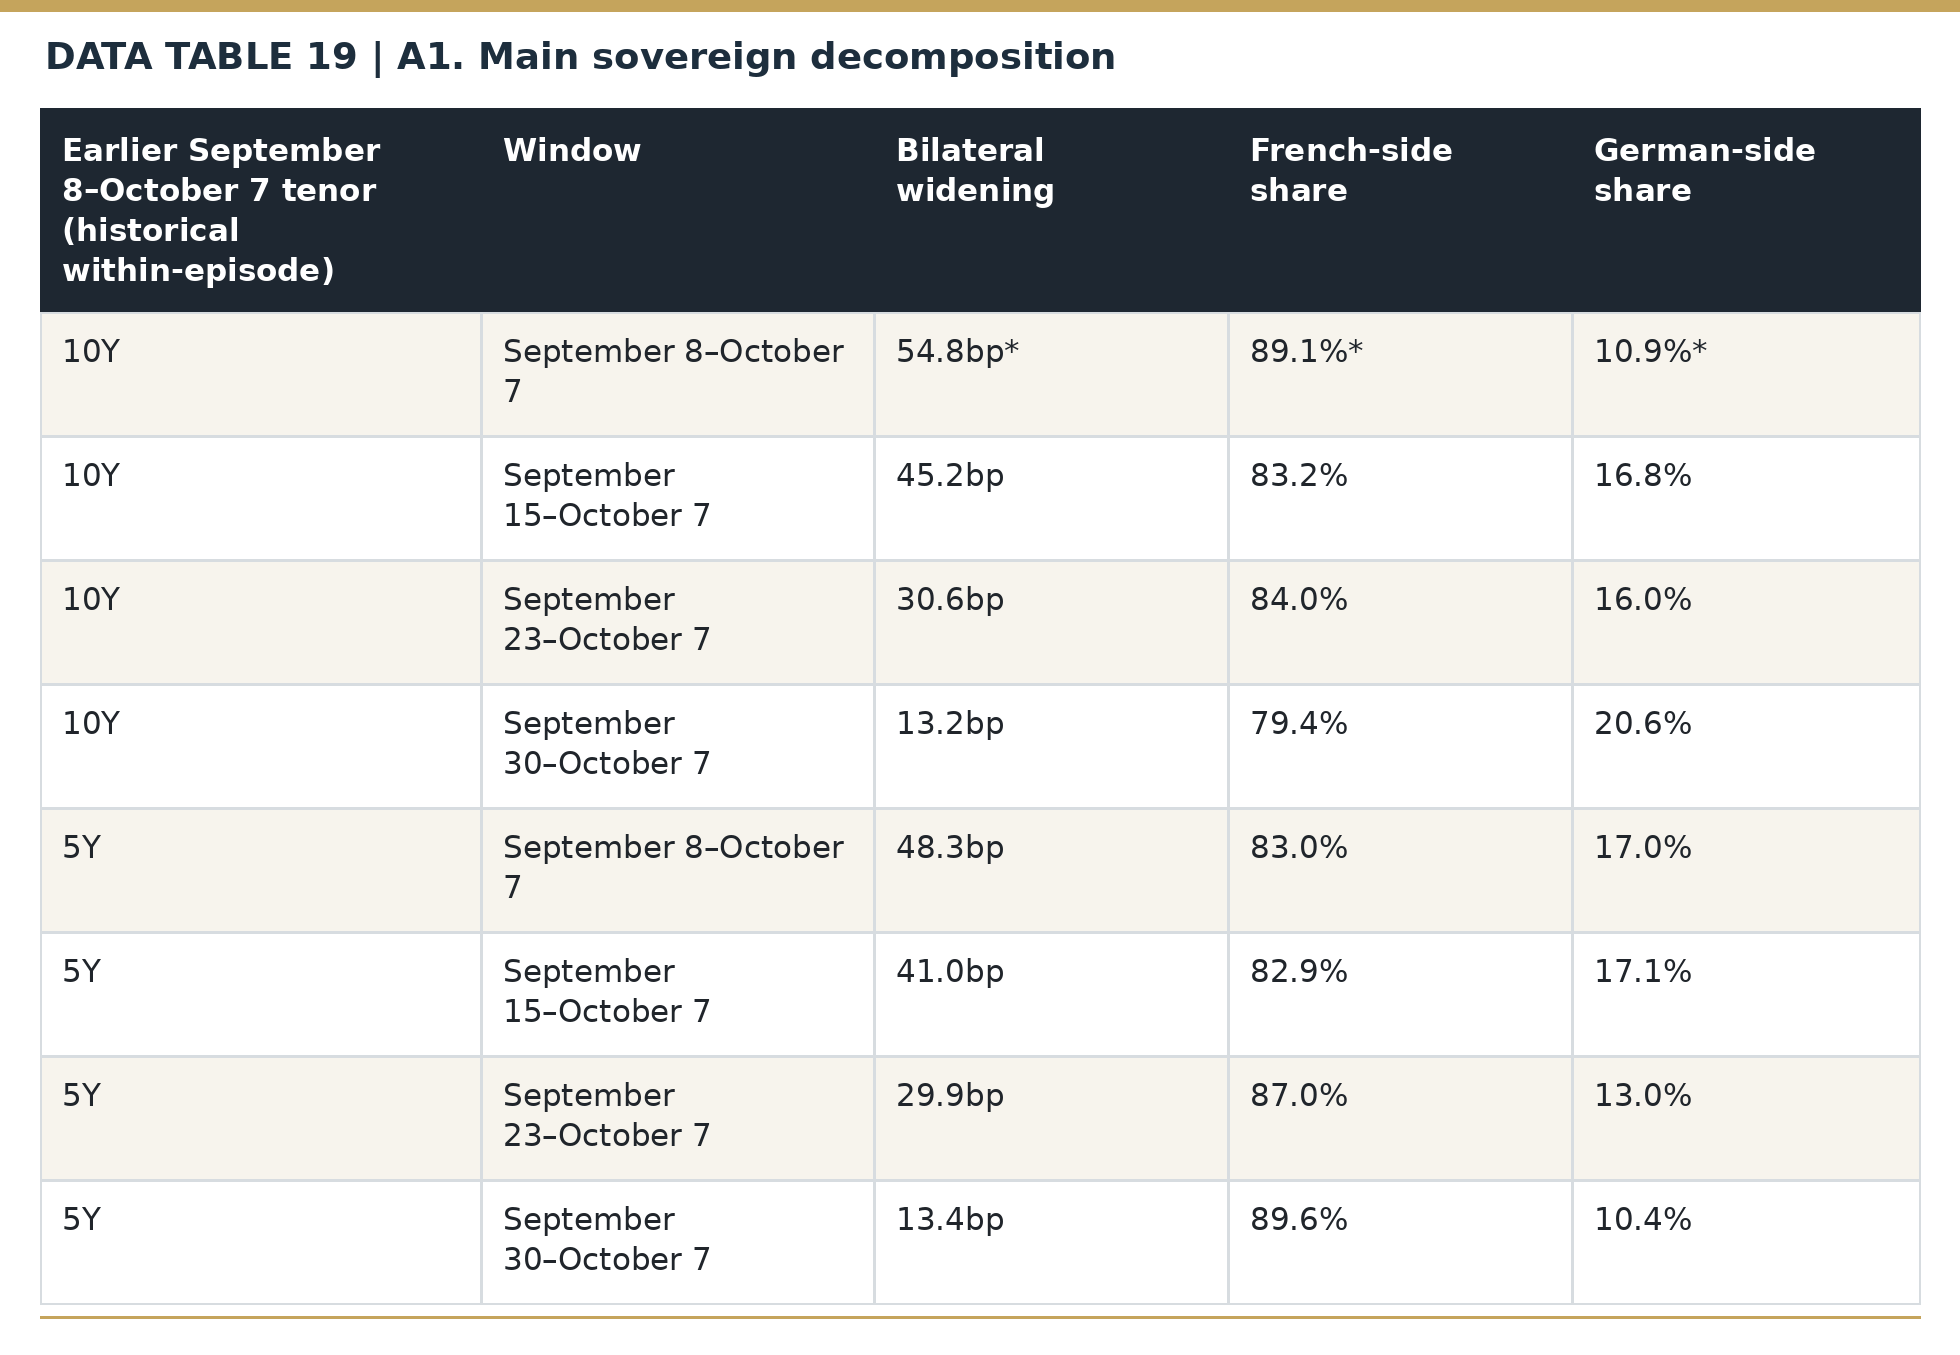
The shorter September 8–October 7 observations in the adjoining table document how the same mechanism operated earlier in the episode; their closing-price conventions are separately identified. The accompanying figure reports the September 24–October 23 and October 7–23 estimates. [3] [4] [5] [6] [7] [8]
Government-yield and swap closes on October 23: FR10Y 5.028%, DE10Y 3.3434%, EUR10Y IRS 3.460%; FR5Y 4.437%, DE5Y 3.142%, EUR5Y IRS 3.415%. Sovereign CDS on October 22: France 96.23bp, Italy 72.85bp and Spain 32.89bp. Bank CDS on October 22: BNP Paribas 69.31bp, UniCredit 53.25bp and Deutsche Bank 61.66bp. Euro exchange-rate fixings on October 23: EUR/USD 1.1193 and EUR/CHF 0.9227. [3] [4] [5] [6] [7] [8] [10] [11] [12] [13] [35] [41] [44] [68]
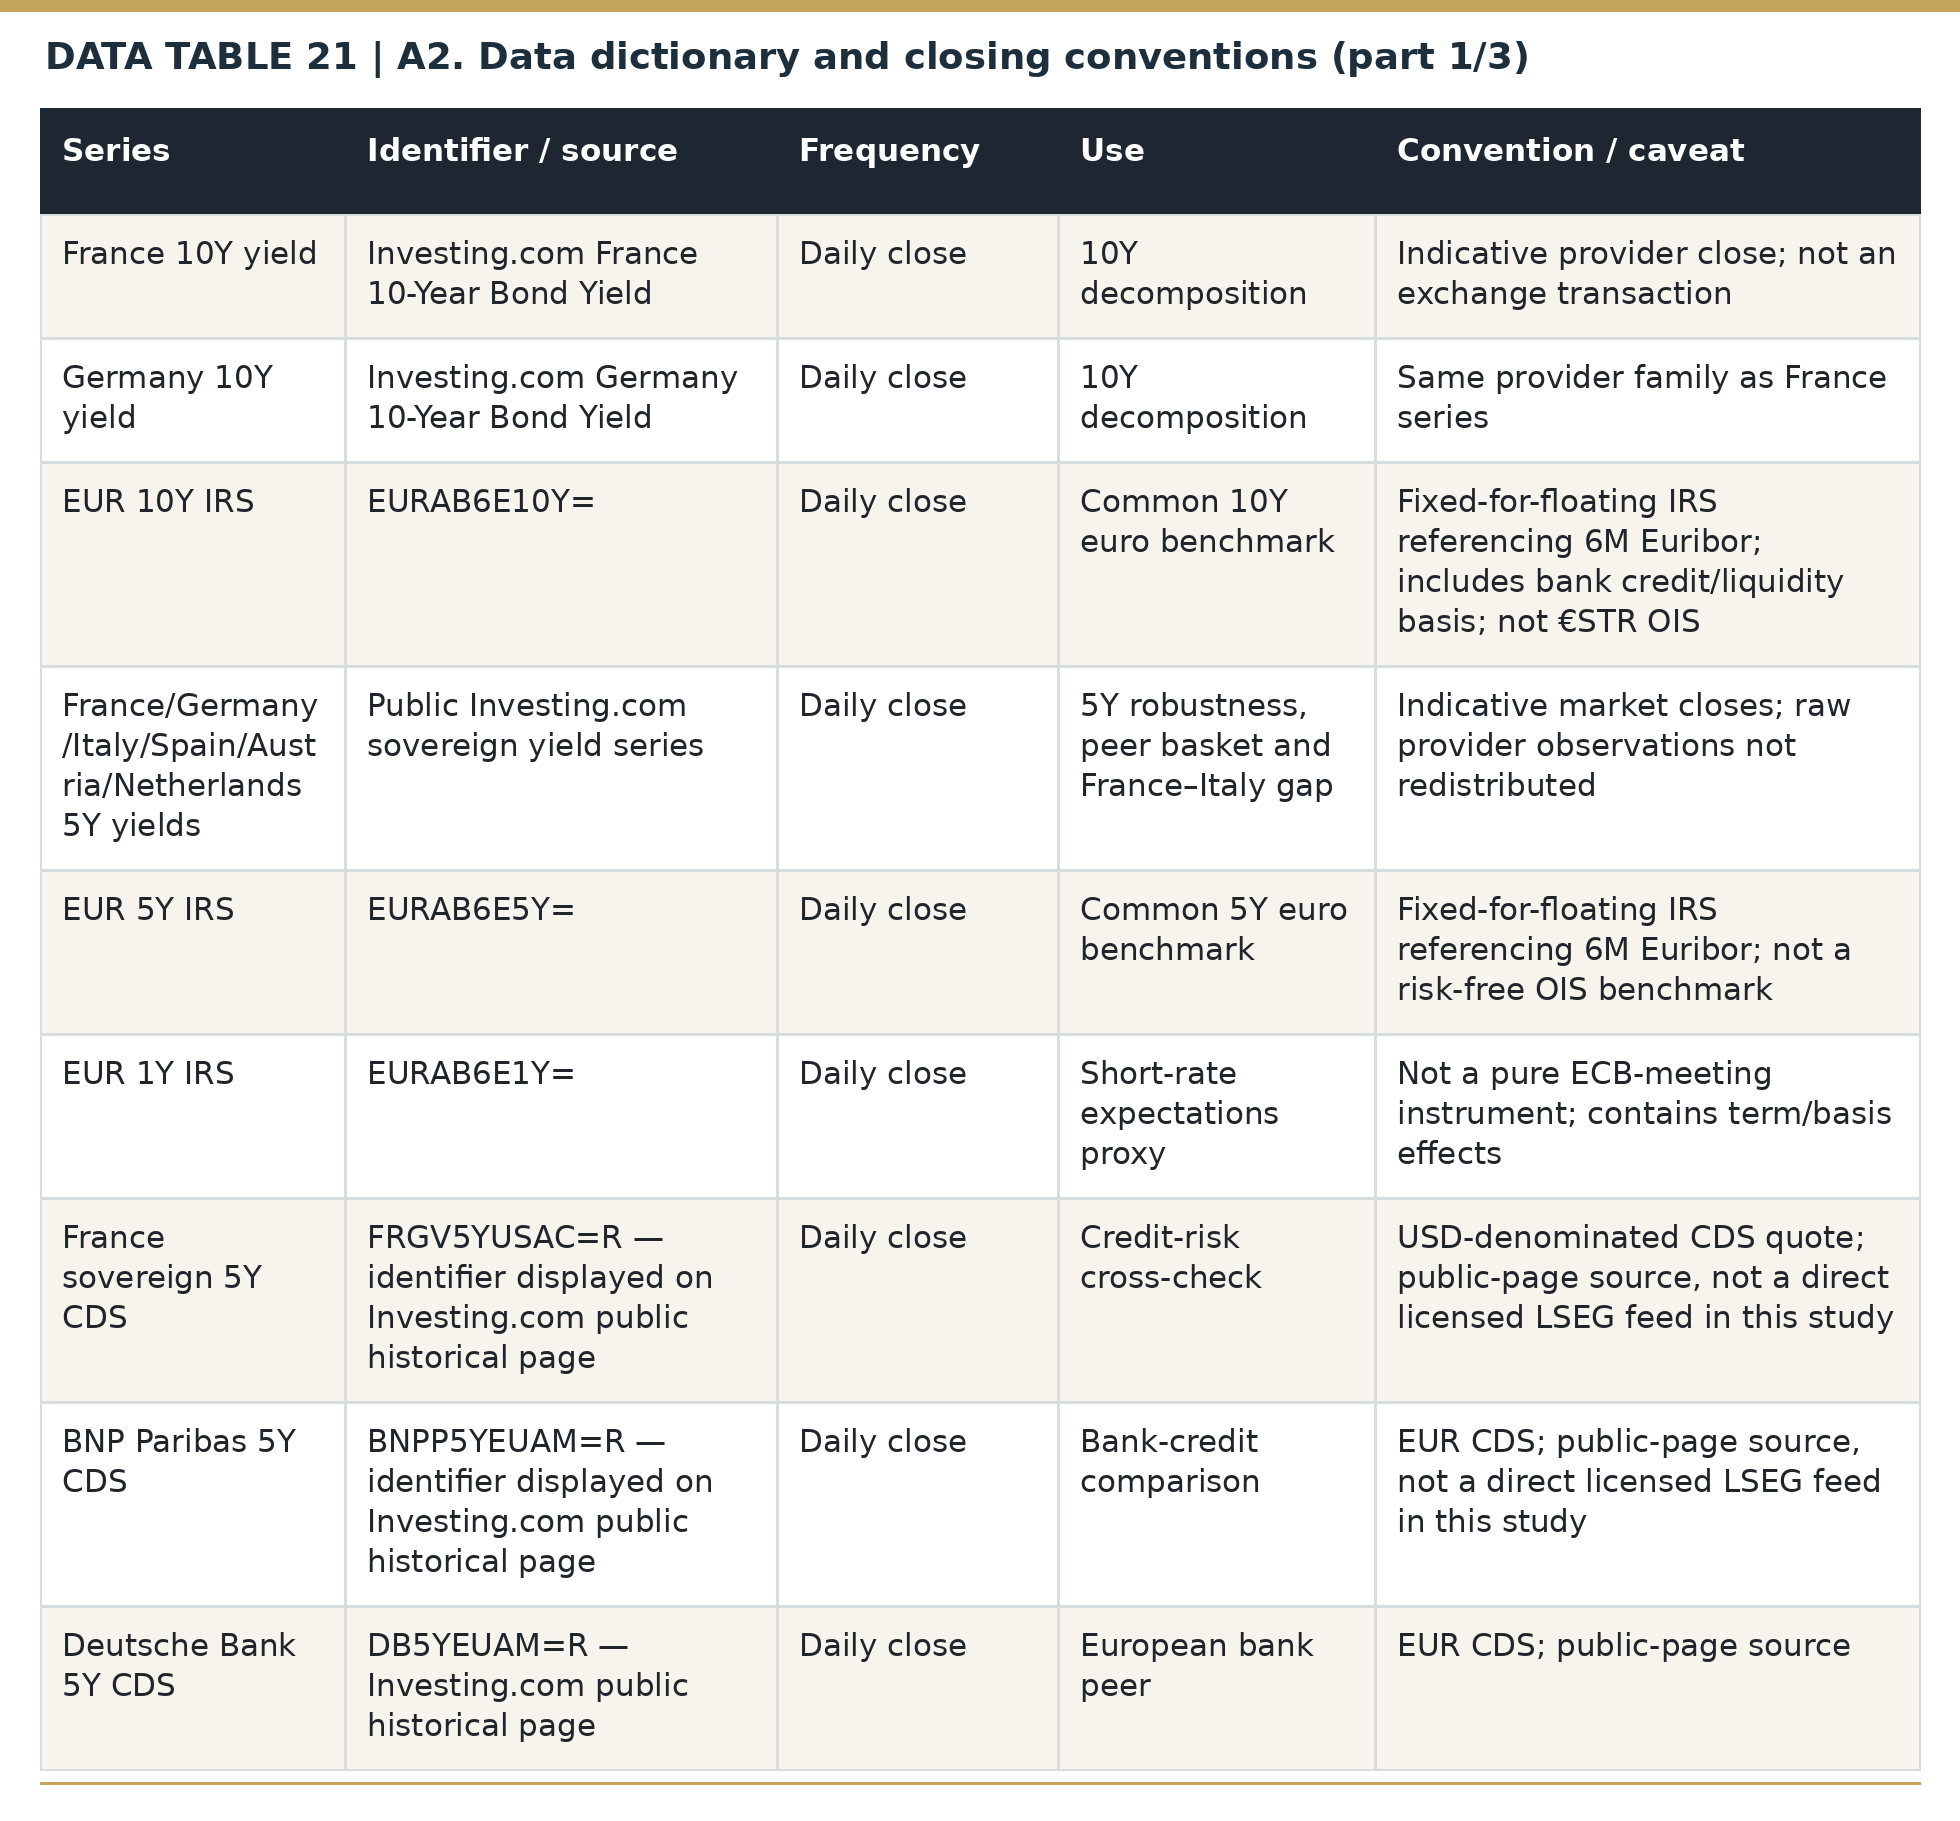
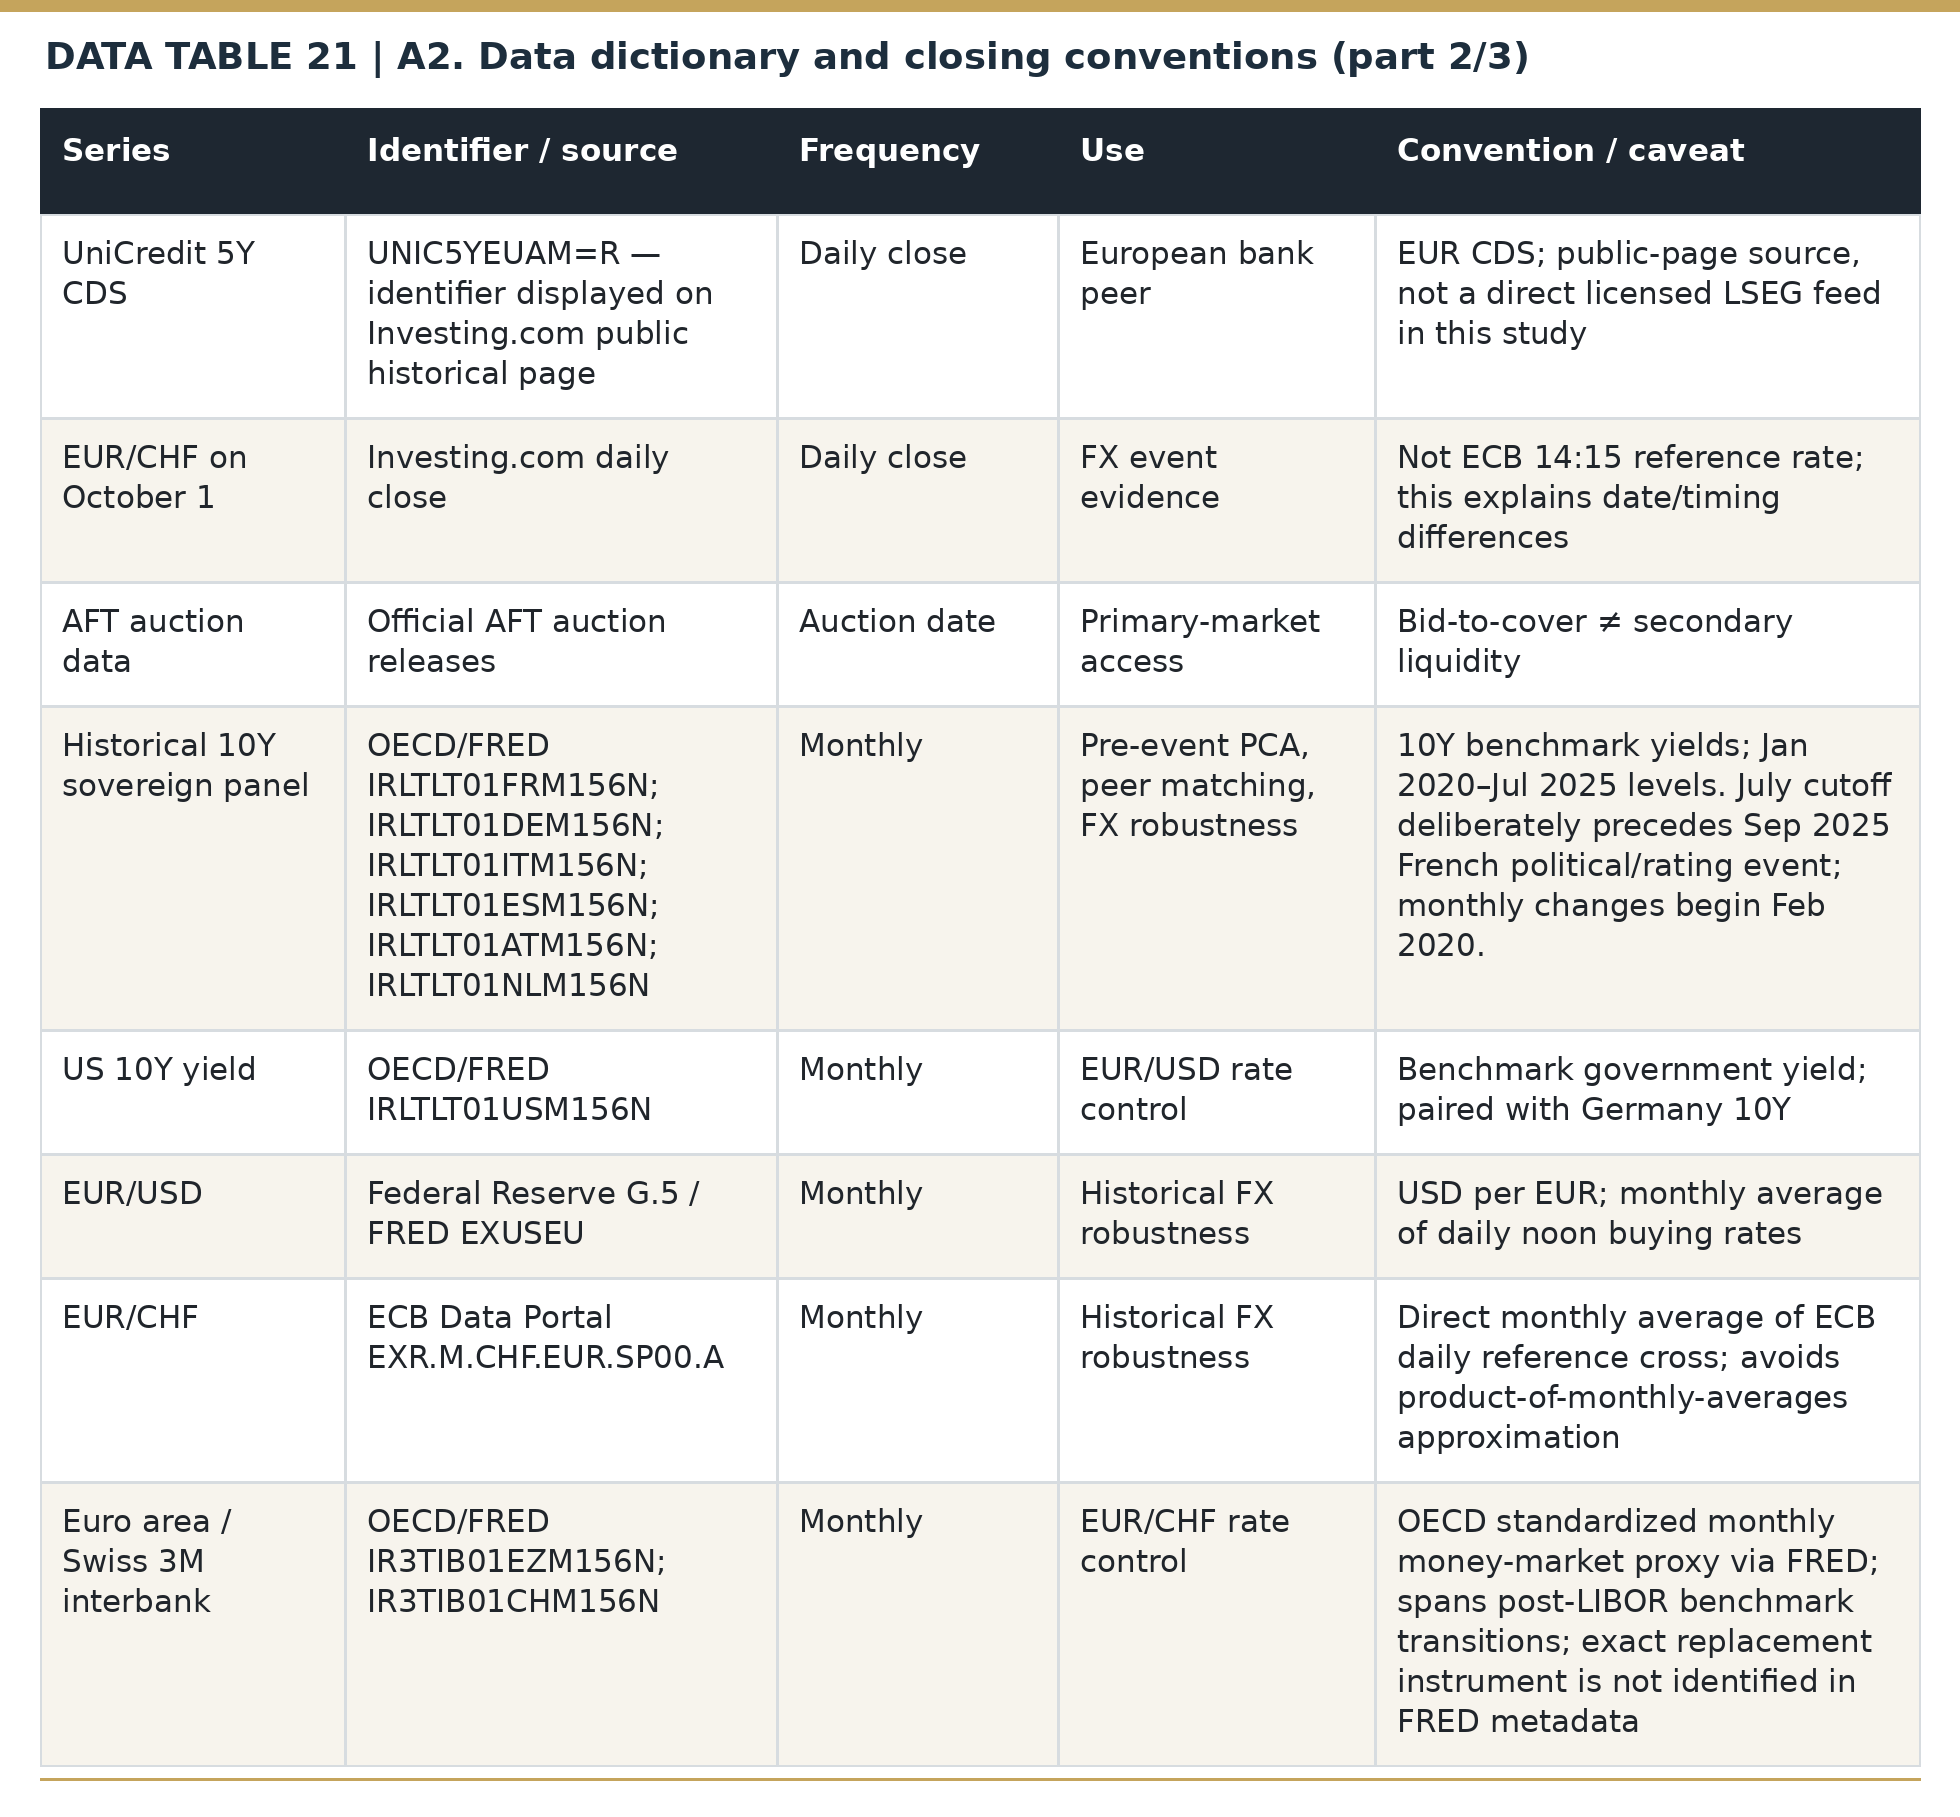
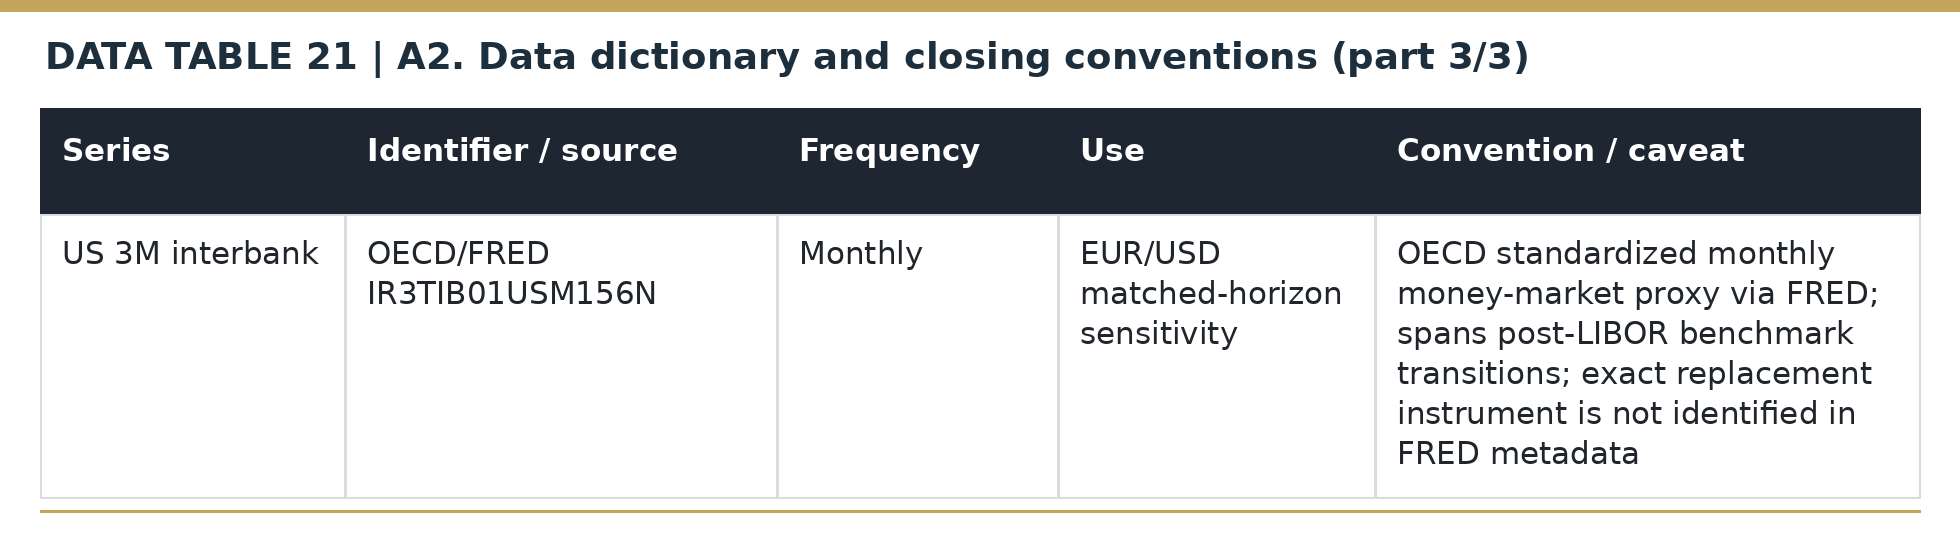
A2. Data dictionary and closing conventions
A3. Pre-event factor validation: benchmark sensitivity, stability and bootstrap tests
The historical factor test uses 66 monthly observations between February 2020 and July 2025, with France excluded from the four-country peer component. We compare the raw changes in peer government yields, their changes relative to Germany, and changes after statistically removing their shared German-yield relationship. This separates genuine cross-country co-movement from movements mechanically induced by using Germany as the common reference. [38]
The first principal component explains 94.84% of variation in raw peer-yield changes and roughly 73% after either comparison with or adjustment for Germany. A second component is unstable across resampling and benchmark choices. The article therefore uses transparent country-group averages for its substantive spillover results and treats PCA as a technical corroboration. [38]
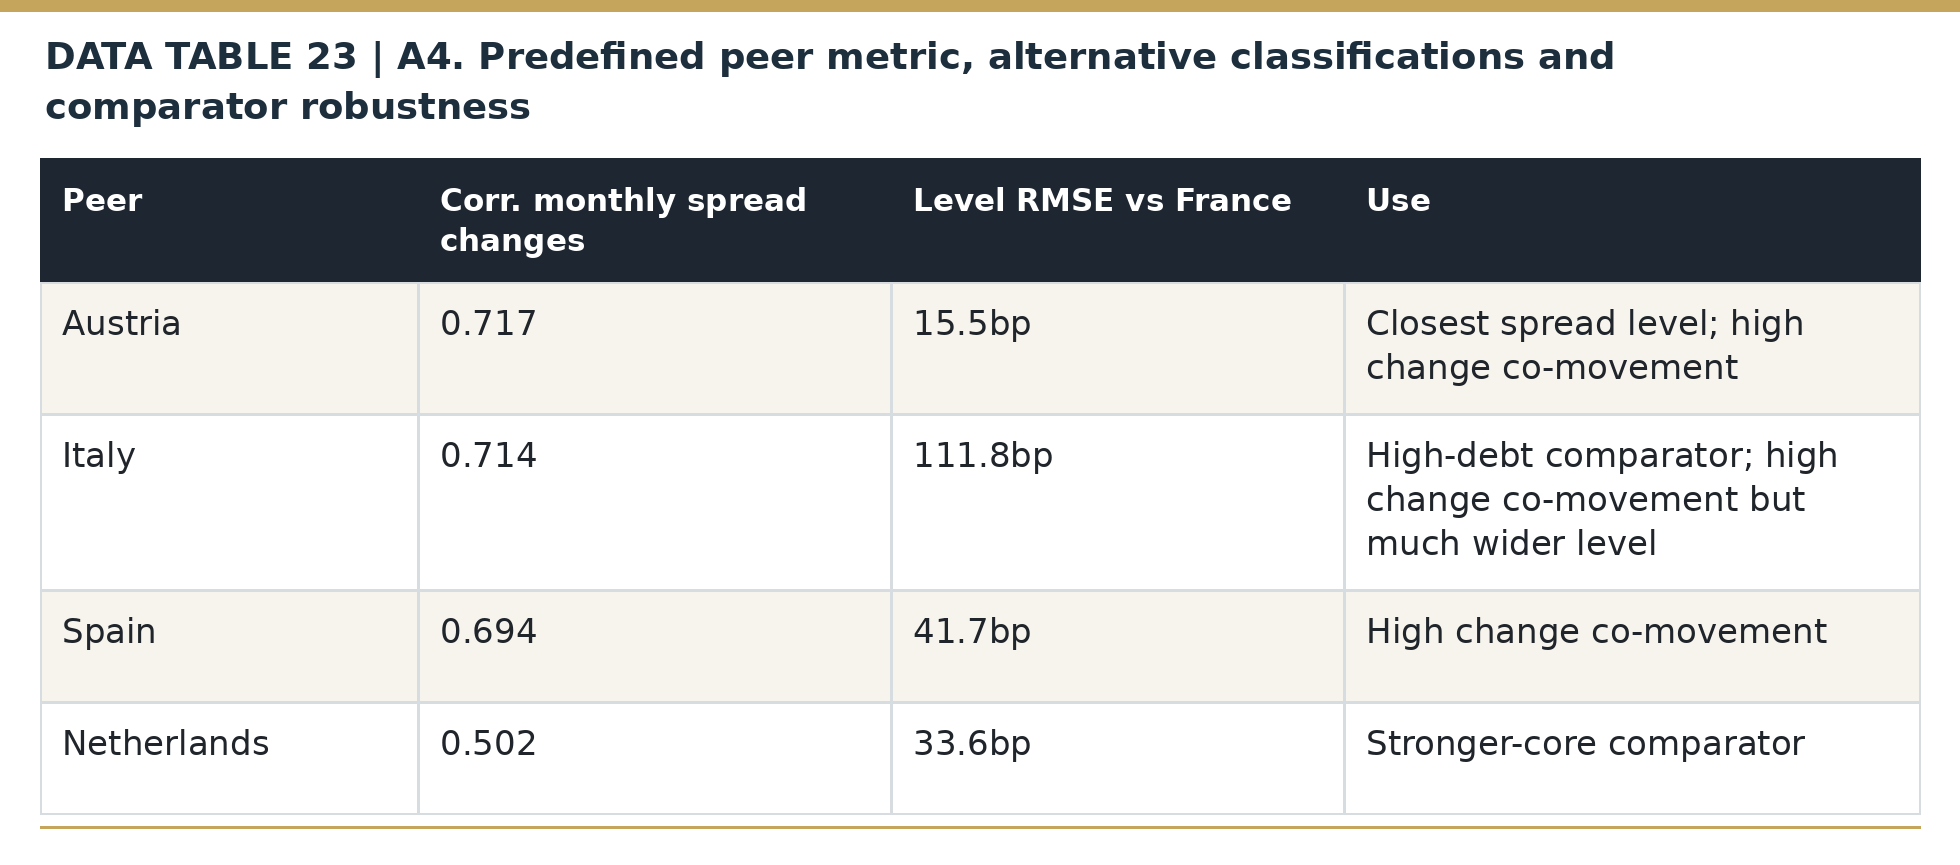
A4. Predefined peer metric, alternative classifications and comparator robustness
The four-country propagation measure is defined in advance:

With Bₜ = ½(Italyₜ + Spainₜ) − ½(Austriaₜ + Netherlandsₜ), each term is a five-year government yield. In the September 8–October 7 period, the difference increased 19.2bp. From October 7 to October 23 it increased 3.05bp in total, with a fall through October 16 and later rebound. Four of eight five-change windows passed the ≥3-of-5 positive-change test, emphasizing uneven late-period spillovers. [9] [49] [50] [51]
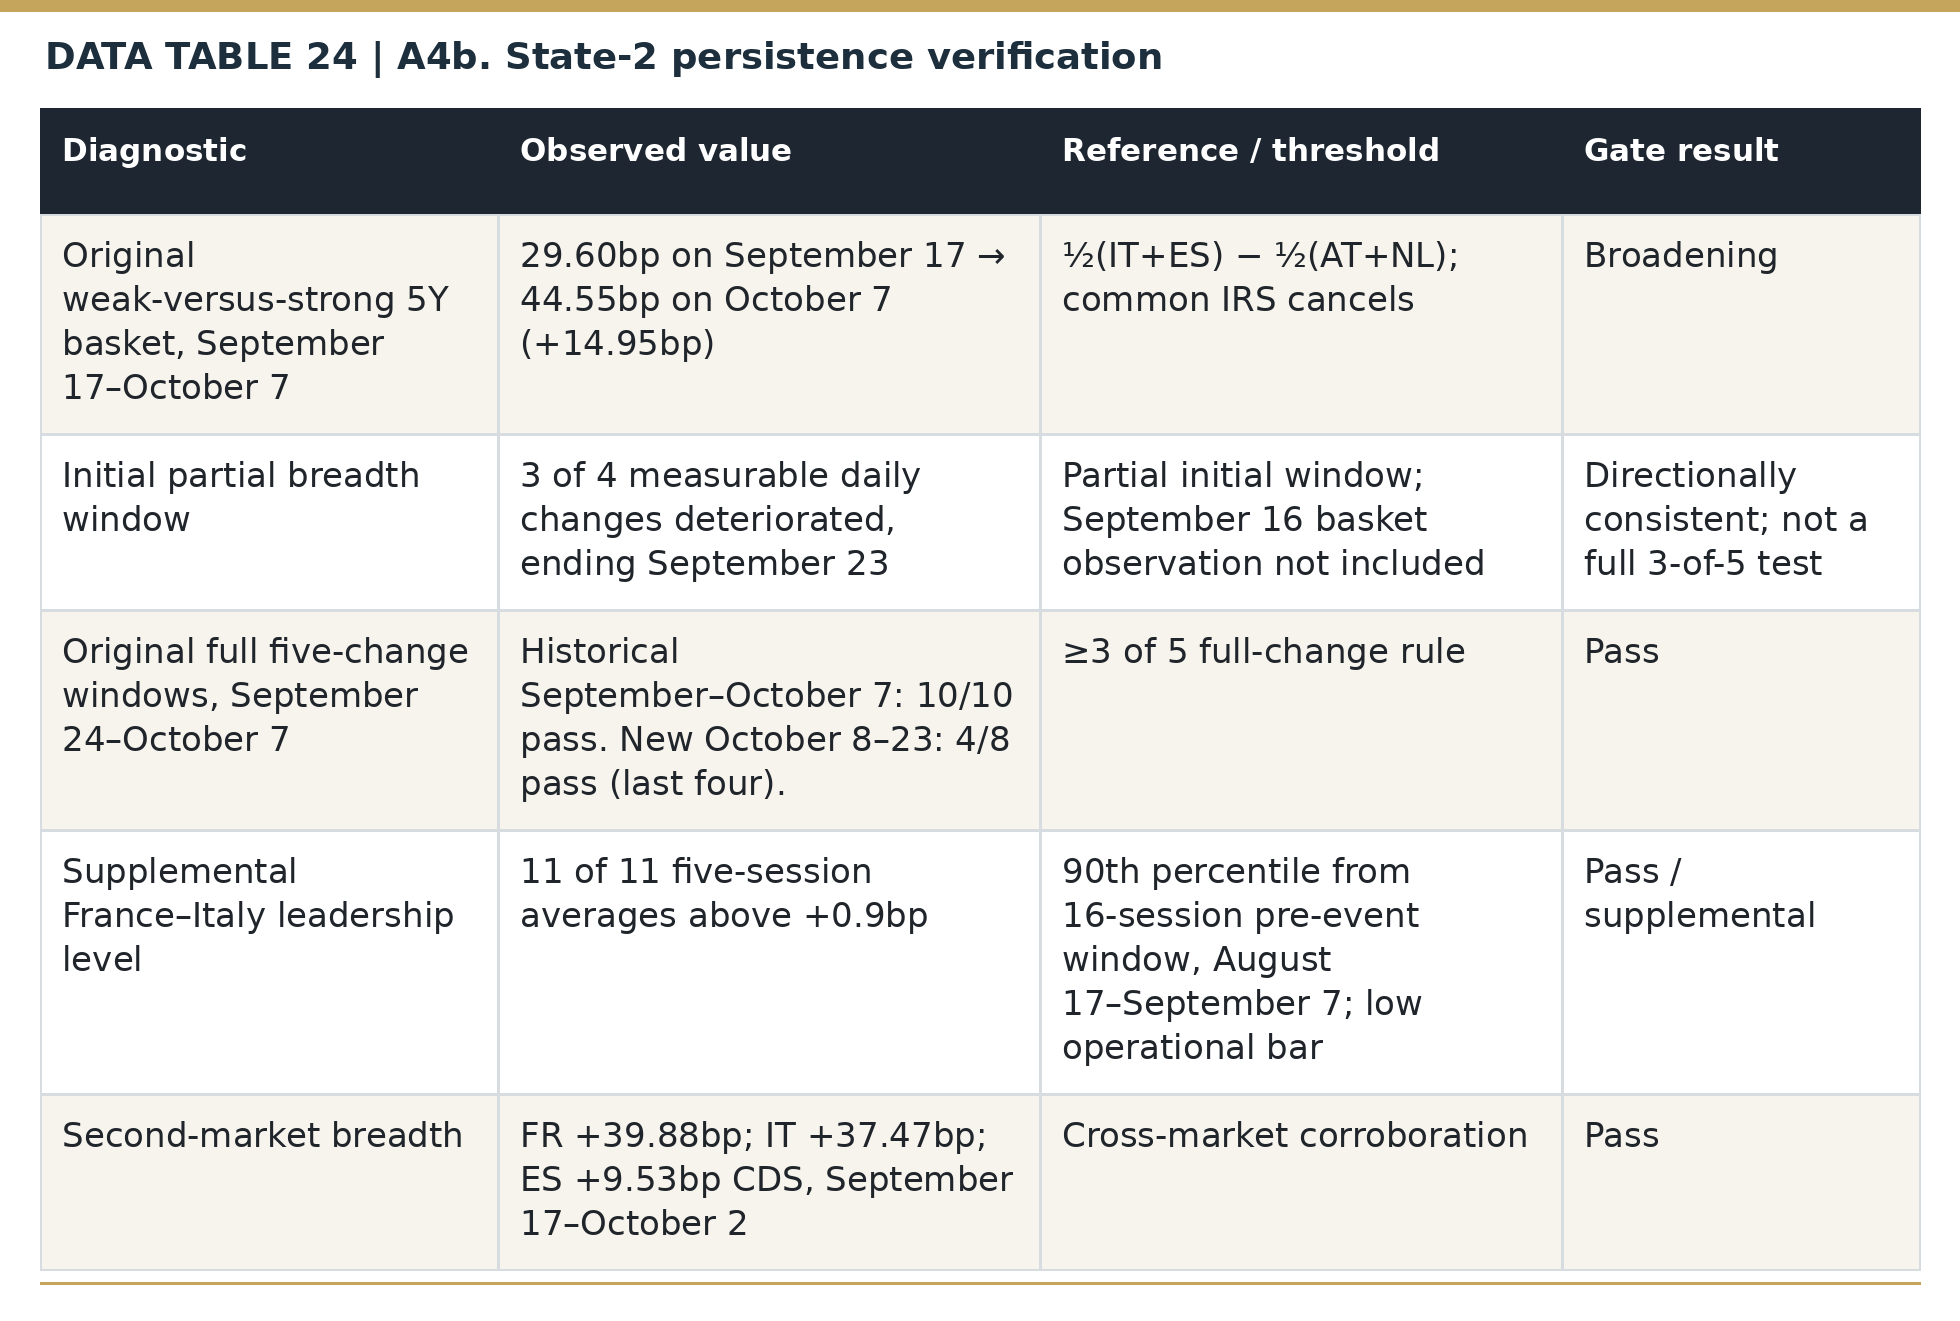
A4b. State-2 persistence verification
For September 17–October 7, ten of ten fully observed rolling five-change windows showed at least three increases in the higher-risk-minus-stronger-core yield basket. Between October 7 and October 23, only the final four of eight such windows met the same rule. This change in persistence distinguishes the earlier European selloff from the more France-led late phase. [9] [10] [35] [44] [49] [50] [51]
The observed five-year peer-basket levels for October 7–23 (bp) are: 44.55, 41.40, 39.00, 39.00, 38.80, 39.45, 38.55, 37.05, 38.65, 41.00, 43.55, 50.95 and 47.60. Their twelve changes yield rolling five-change positive counts of 1, 1, 1, 2, 3, 3, 4 and 4. A zero movement does not count as a widening. [9] [49] [50] [51]
A5. Historical FX model: direct EUR/CHF, interest-rate-control sensitivity and formal stability tests
The FX model uses the N=66 pre-event monthly window from February 2020 through July 2025. The window stops before the September 2025 French government collapse and Fitch downgrade so those events can be used as out-of-sample checks rather than entering the estimation sample. EUR/USD is the Federal Reserve G.5 monthly-average spot series; EUR/CHF is the ECB direct monthly reference-rate series EXR.M.CHF.EUR.SP00.A. Monthly averages smooth intramonth variation, so the exercise is interpreted as a medium-horizon regime robustness test rather than a high-frequency event model. The sovereign regressors are the France–Germany ten-year spread change, the predefined common-peer measure and the predefined credit-quality differentiation measure. The baseline EUR/USD specification controls for the US–Germany ten-year yield differential; EUR/CHF controls for the euro-area–Swiss three-month OECD/FRED interbank differential. An alternative-control sensitivity replaces the EUR/USD long-end government-yield control with the US–euro-area three-month OECD/FRED interbank differential; this changes maturity, benchmark and risk composition together rather than isolating horizon alone. The OECD/FRED three-month series continue through the post-LIBOR period but FRED’s metadata does not identify the precise underlying replacement instrument after CHF LIBOR ended in 2021 and USD LIBOR ended in 2023; they are therefore treated as standardized macro money-market proxies, not instrument-level LIBOR continuations. [38] [39] [40] [41] [42] [43]
Contemporaneous specifications are paired with one-month lags, influence diagnostics and subperiod estimates. Coefficient equality is tested formally with a fully interacted post-2022 specification using HAC covariance. For EUR/USD the France-slope shift is −0.259 (p=0.001) and the joint break test has p=0.003. For EUR/CHF the France-slope shift is −0.031 (p=0.644) and the joint break test has p=0.089. The formal tests therefore support instability in the EUR/USD France coefficient but do not establish a corresponding France-slope break for EUR/CHF. None of these observational tests identifies a structural causal coefficient.
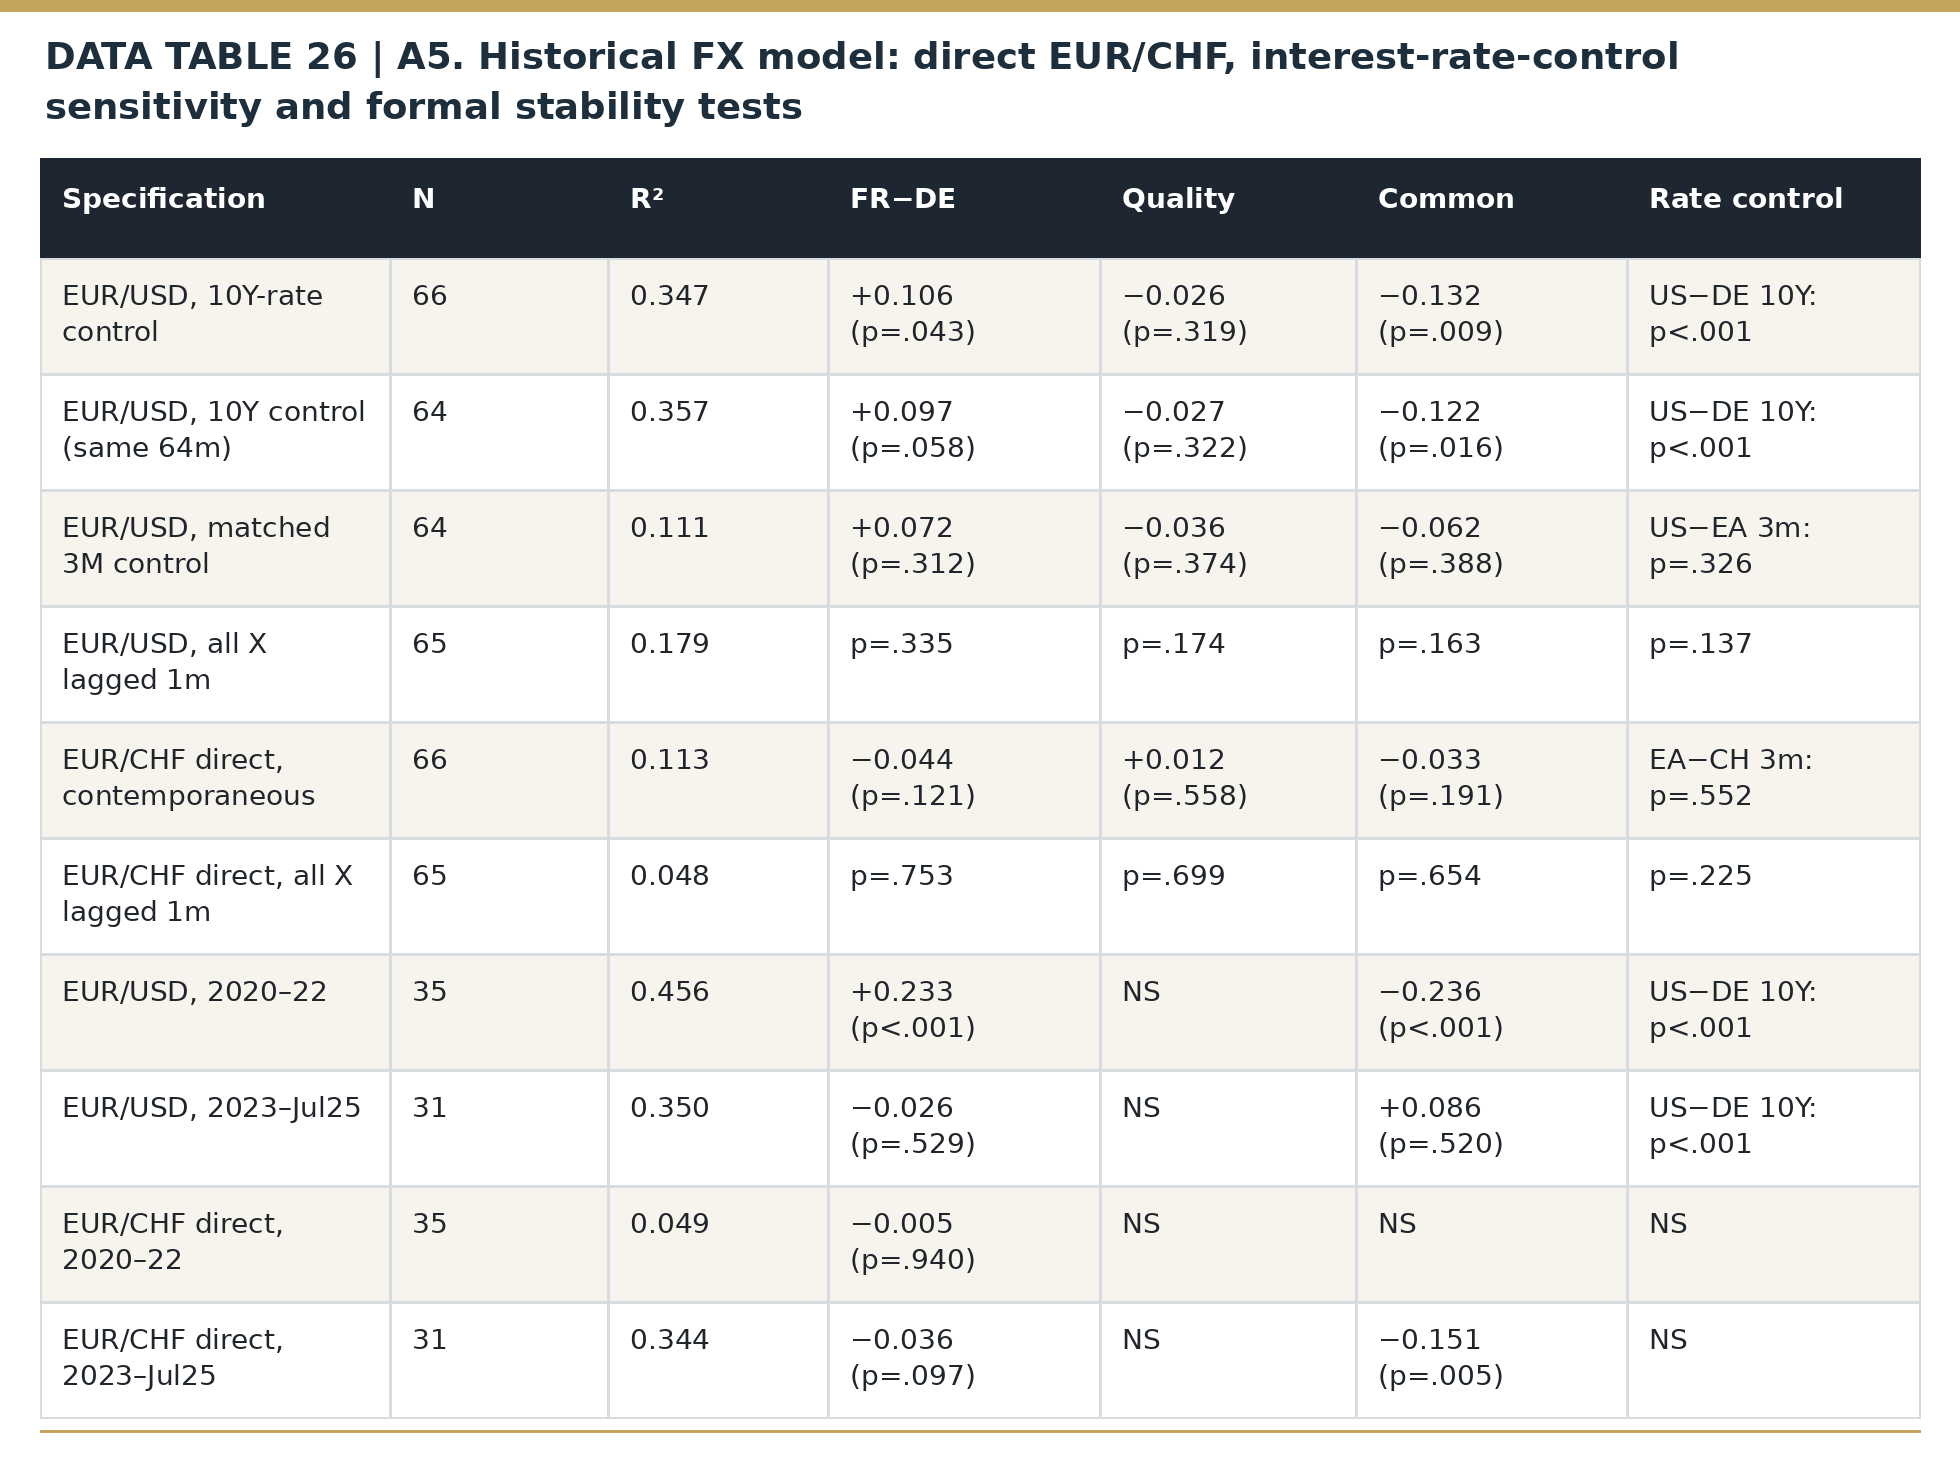
Interest-rate-control specification sensitivity is material for EUR/USD. With the US–Germany ten-year control, the full N=66 model has R²=0.347 and a France coefficient of +0.106 (p=0.043). The three-month specification has N=64 because April and May 2020 are unavailable after differencing the OECD/FRED US–euro-area three-month series. On those same 64 months, the ten-year-control model has R²=0.357 and a France coefficient of +0.097 (p=0.058); the three-month-control model has R²=0.111 and a France coefficient of +0.072 (p=0.312). The comparison therefore demonstrates sensitivity to the control specification, not to maturity alone: the two controls also differ in benchmark, reference jurisdiction and credit/term exposures. In the three-month model the predefined credit-quality measure is −0.036 (p=0.374), the common peer measure is −0.062 (p=0.388) and the short-rate control is −0.018 (p=0.326). The three-month interbank proxies contain funding/credit components and span benchmark transitions, so neither rate control is treated as a pure expected-policy-rate measure.
Auction demand history: official AFT reports provide each issue’s bids and allotments, permitting an aggregate competitive bid-to-cover ratio across every line in a sale. The 2036 bond’s ISIN FR0014018YR0 permits a same-bond comparison across June, July, August, September and October. The yield series is an indicator of price stress, but the needed continuous secondary-market executable bid–ask/depth records are unavailable publicly for a like-for-like liquidity test. [2] [57] [58] [60] [71] [74] [75] [79]
A6. Bank and auction robustness
Bank credit through the freshest verified observations: the matched Investing.com October 2–22 panel has BNP +2.22bp, UniCredit +3.21bp, and Deutsche Bank +2.38bp. A second public vendor independently provides October 2–23 figures for Société Générale +8.10bp (69.90→78.00bp) and Crédit Agricole +5.50bp (62.60→68.10bp). Its final quote is dated October 23 09:00, unlike the Investing.com October 22 close. Thus the evidence now contains three French issuers and two foreign comparators, but cannot produce a homogeneous French-bank/European-bank factor or causal contagion coefficient without aligned contract terms, tick timestamps and a longer panel. We do not claim such an estimate. [11] [12] [13] [72] [73]
AFT auctions: October 1 four fixed-rate lines €27.487bn bid / €11.999bn served = 2.29x, compared with October 15 four different fixed-rate lines €27.356bn / €12.000bn = 2.28x. A separate October 15 inflation-indexed sale €4.151bn / €1.250bn = 3.32x. The repeated 2036 bond cleared in July, September and October 1 with falling coverage and rising yield, but was absent from the October 15 new-maturity basket. On the secondary market, MOT venue October 23 records 66 trades for the 2036 OAT; this is activity, not a comparable liquidity deterioration series. [2] [54] [69] [71]
Event evidence: events are classified by ex-ante information content—surprise, anticipated, or contaminated—and the price convention is stated for each series. No pooled causal coefficient is estimated from heterogeneous political events. This protects the event section against the opposite failure mode of the long-run regressions: treating a few heterogeneous dates as if they were repeated draws from one stable process.
A7. External literature: exact scope
Istrefi, Pagliari & Szczerbowicz (2021), Banque de France Eco Notepad No. 237: 1999–2020; approximately 90-minute ECB press-conference windows; EUR/USD only; monetary-policy target/path surprises identified with OIS; sovereign-spread surprises for France, Italy and Spain versus Germany. The reported significant sovereign-spread FX effects are for Italy and Spain. The study supports an ECB-event fragmentation-risk channel, not a general causal estimate of French political news.
Mosk & de Vette (2025), IMF WP/25/194: constructs a time-varying sovereign-fragmentation indicator with PCA and studies sovereign CDS and corporate bond-spread sensitivity to identified global risk shocks using nonlinear local projections. The paper’s longer fragmentation measure uses weekly data beginning in 2001, while its identified daily shock exercises cover 2008–2024; different empirical components therefore have different sample definitions. The paper establishes stronger bond-market fragility in high-fragmentation states; it does not estimate EUR/USD or EUR/CHF effects.
Kremens (2024), Journal of Financial and Quantitative Analysis: isolates currency redenomination risk using sovereign CDS contract differences and matched controls. French redenomination risk reaches 26bp in March 2017, roughly 40% of the French sovereign CDS premium, before falling sharply after the presidential first round. This is the article’s main theory-grounded quantitative benchmark for a France-specific political/euro-integrity premium.
A8. Historical data notes
France 2017: ECB reported French 10Y spread to OIS widening up to about 40bp ahead of the presidential election; Kremens provides the 26bp redenomination-risk estimate. [19] [20]
Italy 2018: ECB FSR reported the Italian bank index down about 37% since early May; the November policy account noted Italian 2Y/10Y yields about 150/180bp above early-May levels; the dedicated liquidity box documents the May 29 bid-ask and depth breakdown on MTS. [21] [22]
France 2024: ECB Economic Bulletin reported French 10Y spread to €STR OIS widening up to 22bp after the June 9 dissolution, while other sovereign moves broadly unwound by the end of the review period. Banque de France later described the French case as largely idiosyncratic. [23] [24]
Late 2025: the ECB Financial Stability Review states that, following the September French government collapse, French spreads widened but markets remained functional and liquid and there was “no contagion at this stage” from developments in France to other euro-area sovereign bonds. [25]
March 2020 and June 2022: used to calibrate market-functioning/transmission intervention, not as analogues for the source of a French fiscal shock. [26] [27]
Greece: IMF and ESM sources underpin the staged comparison of market-access loss, deposit/funding stress and 2012 restructuring. [28] [29]
A9. TPI eligibility note
ECB eligibility is deliberately described as a constraint rather than an automatic binary exclusion. The official TPI release lists “not being subject to an EDP, or not being assessed as having failed to take effective action” as part of the fiscal-framework criterion, alongside fiscal sustainability and macro-policy criteria. France is under an EDP. Reuters reported on October 8 that officials viewed France as not currently qualifying for intervention. The article therefore treats the backstop as uncertain and conditional, not guaranteed. [16] [17] [18]
A10. Data and news cutoffs through October 25, 2026
Current government-yield, euro-swap and ECB foreign-exchange reference prices end Friday, October 23; directly comparable sovereign and three-bank CDS quotes end Thursday, October 22. Société Générale and Crédit Agricole have additional October 23 morning observations from a second source, included in the individual-bank comparison with their exact dates in the table. Historical monthly regressions use a predefined February 2020–July 2025 sample. The latest public OAT auctions are dated October 15. Independent source conventions yield French–German 10-year spreads near 168–172bp on October 23. [3] [4] [5] [6] [7] [8] [10] [41] [46] [52] [53] [54] [68] [72] [73]
A11. Data accessibility and reproducibility
All market results report the relevant public providers, calendar windows and formulas. Public quotes can later be revised, and selected vendor histories may have access restrictions. The historical factor and currency models use pre-event samples for comparability. A matched daily record of executable French-government bond bid–ask spreads, depth and repo-market stress was not available publicly for the full window, so the secondary-liquidity stage is left unevaluated.
References and source links
[1] Reuters, “Rise in French yields is manageable now, but consolidation pressure might grow, IMF says,” 16 Oct. 2026 — https://uk.finance.yahoo.com/news/rise-french-yields-manageable-now-100636071.html
[2] Agence France Trésor, “01 October 2026: AFT’s issuance: 11.999 billion euros of long-term OATs” — https://www.aft.gouv.fr/en/publications/communiques-presse/01-october-2026-issuance-oats
[3] Investing.com, France 10Y government yield historical data — https://www.investing.com/rates-bonds/france-10-year-bond-yield-historical-data
[4] Investing.com, Germany 10Y government yield historical data — https://www.investing.com/rates-bonds/germany-10-year-bond-yield-historical-data
[5] Investing.com, EUR 10Y IRS historical data (EURAB6E10Y=) — https://www.investing.com/rates-bonds/eur-10-years-irs-interest-rate-swap-historical-data
[6] Investing.com, France 5Y government yield historical data — https://www.investing.com/rates-bonds/france-5-year-bond-yield-historical-data
[7] Investing.com, Germany 5Y government yield historical data — https://www.investing.com/rates-bonds/germany-5-year-bond-yield-historical-data
[8] Investing.com, EUR 5Y IRS historical data (EURAB6E5Y=) — https://www.investing.com/rates-bonds/eur-5-years-irs-interest-rate-swap-historical-data
[9] Investing.com, Italy 5Y government yield historical data — https://www.investing.com/rates-bonds/italy-5-year-bond-yield-historical-data
[10] Investing.com, France sovereign 5Y CDS historical data (FRGV5YUSAC=R) — https://www.investing.com/rates-bonds/france-cds-5-years-usd-historical-data
[11] Investing.com, BNP Paribas 5Y CDS historical data (BNPP5YEUAM=R) — https://www.investing.com/rates-bonds/bnp-paribas-cds-5-year-eur-historical-data
[12] Investing.com, Deutsche Bank 5Y CDS historical data (DB5YEUAM=R) — https://www.investing.com/rates-bonds/deutsche-bank-cds-5-year-eur-historical-data
[13] Investing.com, UniCredit 5Y CDS historical data (UNIC5YEUAM=R) — https://www.investing.com/rates-bonds/unicredit-cds-5-year-eur-historical-data
[14] Banque de France, Istrefi, Pagliari & Szczerbowicz, “Monetary policy, fragmentation risks and the euro,” Eco Notepad No. 237, 4 Nov. 2021 — https://www.banque-france.fr/en/publications-and-statistics/publications/monetary-policy-fragmentation-risks-and-euro
[15] Mosk & de Vette, IMF WP/25/194, “Euro Area Financial Fragmentation and Bond Market Stability,” 26 Sep. 2025 — https://www.imf.org/en/publications/wp/issues/2025/09/26/euro-area-financial-fragmentation-and-bond-market-stability-570057
[16] ECB, “The Transmission Protection Instrument,” 21 July 2022 — https://www.ecb.europa.eu/press/pr/date/2022/html/ecb.pr220721~973e6e7273.en.html
[17] Reuters, “Euro zone ministers tell France to pass 2027 budget to calm markets,” 8 Oct. 2026 — https://www.reuters.com/business/finance/euro-zone-ministers-tell-france-pass-2027-budget-calm-markets-2026-10-08/
[18] European Commission, France — Excessive Deficit Procedure — https://economy-finance.ec.europa.eu/economic-and-fiscal-governance/stability-and-growth-pact/corrective-arm-excessive-deficit-procedure_en
[19] ECB, Financial Stability Review, May 2017 — https://www.ecb.europa.eu/pub/pdf/other/financialstabilityreview201705.en.pdf
[20] Kremens, “Currency Redenomination Risk,” Journal of Financial and Quantitative Analysis, 2024 — https://www.cambridge.org/core/services/aop-cambridge-core/content/view/11479F48B892FF48D6859CB18BAE12BB/S002210902300087Xa.pdf/currency-redenomination-risk.pdf
[21] ECB, Financial Stability Review, November 2018 — https://www.ecb.europa.eu/pub/pdf/fsr/ecb.fsr201811.en.pdf
[22] Cera, Düring & Kördel, ECB Financial Stability Review, Box 3, “Liquidity conditions in the Italian sovereign bond market since May,” Nov. 2018 — https://www.ecb.europa.eu/press/financial-stability-publications/fsr/html/ecb.fsr201811.en.html#toc26
[23] Banque de France, Financial Stability Report, December 2024 — https://www.banque-france.fr/en/publications-and-statistics/publications/financial-stability-report-december-2024
[24] ECB, Economic Bulletin Issue 5/2024 — https://www.ecb.europa.eu/press/economic-bulletin/html/eb202405.en.html
[25] ECB, Financial Stability Review, November 2025 — https://www.ecb.europa.eu/press/financial-stability-publications/fsr/pdf/ecb.fsr202511~263b5810d4.en.pdf
[26] ECB Economic Bulletin 5/2020, “The impact of the ECB’s monetary policy measures taken in response to the COVID-19 crisis” — https://www.ecb.europa.eu/press/economic-bulletin/focus/2020/html/ecb.ebbox202005_03~12b5ff68bf.en.html
[27] ECB, “Statement after the ad hoc meeting of the ECB Governing Council,” 15 June 2022 — https://www.ecb.europa.eu/press/pr/date/2022/html/ecb.pr220615~2aa3900e0a.en.html
[28] IMF, “Greece: Ex-Post Evaluation of Exceptional Access Under the 2012 Extended Arrangement,” Country Report No. 17/44, 7 Feb. 2017 — https://www.imf.org/en/Publications/CR/Issues/2017/02/07/Greece-Ex-Post-Evaluation-of-Exceptional-Access-under-the-2012-Extended-Arrangement-Press-44636
[29] European Stability Mechanism, “What was the private sector debt restructuring in March 2012?” — https://www.esm.europa.eu/content/what-was-private-sector-debt-restructuring-march-2012
[30] Assemblée nationale, Conference of Presidents, 29 Sep. 2026 budget timetable — https://www2.assemblee-nationale.fr/17/la-conference-des-presidents/releve-de-conclusions/reunion-du-mardi-29-septembre-2026
[31] Reuters, “Moody’s sees no quick resolution of French political fragmentation,” 2 Oct. 2026 — https://www.reuters.com/business/moodys-sees-no-quick-resolution-french-political-fragmentation-2026-10-02/
[32] ECB, Account of the monetary policy meeting, 9–10 Sep. 2026 — https://www.ecb.europa.eu/press/accounts/2026/html/ecb.mg261008~a10153d090.en.html
[33] Reuters, “Europe’s bond market turmoil shines a spotlight on hedge funds’ role,” 16 Oct. 2026 — https://www.investing.com/news/economy-news/analysiseuropes-bond-market-turmoil-shines-a-spotlight-on-hedge-funds-role-in-key-markets-4953095
[34] Reuters, “ECB’s Lagarde says bond selloff will slow inflation,” 17 Oct. 2026 — https://www.investing.com/news/economy-news/ecbs-lagarde-says-bond-selloff-will-slow-inflation-4955322
[35] Investing.com, Italy sovereign 5Y CDS historical data (ITGV5YUSAC=R) — https://www.investing.com/rates-bonds/italy-cds-5-years-usd-historical-data
[36] Investing.com, EUR 1Y IRS historical data (EURAB6E1Y=) — https://www.investing.com/rates-bonds/eur-1-year-irs-interest-rate-swap-historical-data
[37] Reuters, Dombrovskis: no signs of new EU debt crisis, 14 Oct. 2026 — https://www.investing.com/news/economy-news/no-signs-of-new-eu-debt-crisis-but-prudent-fiscal-policy-is-needed--dombrovskis-4948613
[38] OECD Main Economic Indicators via FRED, monthly 10-year benchmark government bond yields: France IRLTLT01FRM156N, Germany IRLTLT01DEM156N, Italy IRLTLT01ITM156N, Spain IRLTLT01ESM156N, Austria IRLTLT01ATM156N, Netherlands IRLTLT01NLM156N — https://fred.stlouisfed.org/
[39] OECD/FRED, US 10-year benchmark government bond yield IRLTLT01USM156N — https://fred.stlouisfed.org/series/IRLTLT01USM156N
[40] Federal Reserve G.5 via FRED, U.S. Dollars to Euro Spot Exchange Rate EXUSEU — https://fred.stlouisfed.org/series/EXUSEU
[41] ECB Data Portal, Swiss franc/Euro ECB reference exchange rate, Monthly, EXR.M.CHF.EUR.SP00.A — https://data.ecb.europa.eu/data/datasets/EXR
[42] OECD/FRED, three-month interbank rates for the euro area IR3TIB01EZM156N and Switzerland IR3TIB01CHM156N — https://fred.stlouisfed.org/series/IR3TIB01EZM156N ; https://fred.stlouisfed.org/series/IR3TIB01CHM156N
[43] OECD/FRED, US three-month interbank rate IR3TIB01USM156N — https://fred.stlouisfed.org/series/IR3TIB01USM156N
[44] Investing.com, Spain sovereign 5Y CDS historical data (ESGV5YUSAC=R) — https://www.investing.com/rates-bonds/spain-cds-5-years-usd-historical-data
[45] Countryeconomy.com, secondary-aggregator 10-year sovereign spreads to Germany for France, Italy, Spain and the Netherlands, September–October 2026; used only as an independent robustness cross-check — https://countryeconomy.com/risk-premium/france ; https://countryeconomy.com/risk-premium/italy ; https://countryeconomy.com/risk-premium/spain ; https://countryeconomy.com/risk-premium/netherlands
[46] Ideal-Investisseur, OAT/Bund spread daily-close history; secondary independent close-convention cross-check — https://www.ideal-investisseur.fr/en/markets/oat-bund-spread.html
[47] Investing.com, “EUR/USD Faces Fresh Pressure From Brent Above $105,” October 2026; contemporaneous market analysis reproducing the 8 Sep and 7 Oct French/German 10Y observations — https://ng.investing.com/analysis/eurusd-faces-fresh-pressure-from-brent-above-105-219934
[48] Reuters, “Investors pick new darlings and duds as selloff rocks Europe’s bond market,” 7 Oct. 2026 — https://www.reuters.com/business/investors-pick-new-darlings-duds-selloff-rocks-europes-bond-market-2026-10-07/
[49] Investing.com, Spain 5Y government yield historical data — https://www.investing.com/rates-bonds/spain-5-year-bond-yield-historical-data
[50] Investing.com, Austria 5Y government yield historical data — https://www.investing.com/rates-bonds/austria-5-year-bond-yield-historical-data
[51] Investing.com, Netherlands 5Y government yield historical data — https://www.investing.com/rates-bonds/netherlands-5-year-bond-yield-historical-data
[52] Macropole, daily French TEC 10 minus Bundesbank 10-year constant-maturity government rate, 23 Oct. 2026 (168.8bp) — https://macropole.fr/s/fr.oat.spread.bund.d
[53] Ideal-Investisseur, OAT/Bund 10-year daily-close series, 23 Oct. 2026 (171.8bp) — https://www.ideal-investisseur.fr/marches/spread-oat-bund.html
[54] Agence France Trésor, October 2026 primary OAT auction results including 1 and 15 Oct — https://www.aft.gouv.fr/en/dernieres-adjudications
[55] Insee, General-government accounts for 2025: deficit, expenditure and debt, updated May 2026 — https://www.insee.fr/fr/statistiques/8997691
[56] OECD, Economic Surveys: France 2026, structural fiscal balance and spending analysis — https://www.oecd.org/en/publications/oecd-economic-surveys-france-2026_e88a1716-en/full-report/putting-public-finances-on-a-sustainable-path-while-boosting-long-term-growth_a7381159.html
[57] Agence France Trésor, long-term OAT auction results, 2 Oct. 2025 — https://www.aft.gouv.fr/en/publications/communiques-presse/20251002-issuance-oats
[58] Agence France Trésor, long-term OAT auction results, 3 Oct. 2024 — https://www.aft.gouv.fr/en/publications/communiques-presse/03-october-2024-issuance-oats
[59] STOXX, EURO STOXX Banks index: constituents and benchmark history, viewed 24 Oct. 2026 — https://stoxx.com/index/sx7t/
[60] Agence France Trésor, long-term OAT auction results, 5 Oct. 2023 — https://www.aft.gouv.fr/en/publications/communiques-presse/05-october-2023-issuance-oats
[61] ECB, market liquidity measurement using bid–ask spreads, depth and turnover; ECB 2026 material — https://www.ecb.europa.eu/press/financial-stability-publications/fsr/html/ecb.fsr202605~50566915a7.en.html
[62] Reuters, via Euronext, “France spared Moody’s ratings downgrade as it struggles with unrest,” 23 Oct. 2026 — https://live.euronext.com/en/financial-news/france-spared-moodys-ratings-downgrade-it-struggles-unrest
[63] French National Assembly, rejection at first reading of the 2027 Social Security Financing Bill, 23 Oct. 2026 — https://www.assemblee-nationale.fr/dyn/actualites-accueil-hub/rejet-en-premiere-lecture-du-projet-de-loi-de-financement-de-la-securite-sociale-pour-2027
[64] Cour des comptes, annual report and publications on France public finances; primary source for policy account — https://www.ccomptes.fr/sites/default/files/2025-07/20250702-RSPFP-2025_0.pdf
[65] French Government, Council of Ministers account, 1 Oct. 2026, deficit targets for 2026 and 2027 — https://www.info.gouv.fr/conseil-des-ministres/compte-rendu-du-conseil-des-ministres-du-01-10-2026
[66] Investing.com 23 Oct. 2026 France/Germany ten-year yield closes (5.028%/3.3434%) and 7 Oct. comparison (4.869%/3.4805%); see public 10Y historical pages already [3] and [4].
[67] Countryeconomy.com 10-year daily spreads to Germany for France, Italy, Spain, Austria and Netherlands through 23 Oct. 2026 — https://countryeconomy.com/risk-premium/france ; https://countryeconomy.com/risk-premium/italy ; https://countryeconomy.com/risk-premium/spain ; https://countryeconomy.com/risk-premium/austria ; https://countryeconomy.com/risk-premium/netherlands
[68] ECB euro foreign-exchange reference rates, 23 Oct. 2026 (USD 1.1193 and CHF 0.9227 per euro), with Oct 7 dates from historical ECB reference-rate archive — https://www.ecb.europa.eu/stats/policy_and_exchange_rates/euro_reference_exchange_rates/html/index.eu.html ; historical daily ECB fixing archive: https://fincast.info/pairs/eur-usd/archive ; https://fincast.info/pairs/eur-chf/archive
[69] Borsa Italiana MOT venue, OAT 3.70% November 2036, ISIN FR0014018YR0, 23 Oct. 2026 market activity: 66 contracts/trades and displayed total volume 1,759,089 units — https://www.borsaitaliana.it/borsa/obbligazioni/mot/euro-obbligazioni/scheda/FR0014018YR0-MOTX.html?lang=it
[70] JPMorgan Asset Management, Bond Bulletin, 8 Oct. 2026, discusses global duration and positioning mechanisms (market commentary rather than causal identification) — https://am.jpmorgan.com/at/de/asset-management/adv/insights/portfolio-insights/fixed-income/weekly-bond-bulletin/weekly-bond-bulletin-08-oct-2026/
[71] Agence France Trésor, 3 September 2026 long-term OAT issuance including 3.70% November 2036 reopened bond, bid-to-cover 2.28x, rate 4.23% — https://www.aft.gouv.fr/en/publications/communiques-presse/03-september-2026-issuance-oats
[72] Boursorama, CDS-5A Société Générale (SOCGEN), dated 2 Oct. 2026 quote 69.90bp and 23 Oct. 2026 09:00 quote 78.00bp — https://www.boursorama.com/cours/cds/3xSOCGEN/ ; historical archive https://www.boursorama.com/cours/cds/3xSOCGEN/page-7
[73] Boursorama, CDS-5A Crédit Agricole SA (ACAFP), dated 2 Oct. 2026 quote 62.60bp and 23 Oct. 2026 09:00 quote 68.10bp — https://www.boursorama.com/cours/cds/3xACAFP/ ; historical observation https://www.boursorama.com/bourse/taux/cours/3xACAFP/
Additional references — expanded French fiscal root-cause analysis (RC1–RC22)
[RC1] OECD, OECD Economic Surveys: France 2026 — “Putting public finances on a sustainable path while boosting long-term growth”. Source link
[RC2] Insee, General Government Accounts in 2025, May 2026. Source link
[RC3] Cour des comptes, Public Finances: Situation and Outlook, July 2025 summary. Source link
[RC4] Insee, General government accounts in 2023. Source link
[RC5] Insee, General government accounts in 2024. Source link
[RC6] Cour des comptes, Situation and outlook for public finances — 2020 shock summary. Source link
[RC7] Cour des comptes, Measures taken to address the rise in energy prices, March 2024. Source link
[RC8] French Ministry of Economy and Finance, 2018 Stability Programme presentation. Source link
[RC9] IMF, France 2019 Article IV — Box 1, Policy Responses to the Gilets Jaunes Protests. Source link
[RC10] French Ministry of Economy and Finance, 2020 Budget Act — tax measures. Source link
[RC11] French Ministry of Economy and Finance, production-tax reform / 2023 budget measures. Source link
[RC12] Direction générale du Trésor, Review of public-finance forecasts for 2023 and 2024, July 2025. Source link
[RC13] Reuters, “Fall of government leaves France without clear path to cutting deficit — S&P”, 5 Dec. 2024. Source link
[RC14] Reuters, “Crisis-prone France sinks deeper into debt quagmire”, 8 Sep. 2025. Source link
[RC15] Reuters, “Fitch downgrades crisis-strained France”, 12 Sep. 2025. Source link
[RC16] Reuters, “What is in France’s 2026 budget?”, 2 Feb. 2026. Source link
[RC17] Reuters, “France flags 2027 budget squeeze as defence and debt costs surge”, 16 Jul. 2026. Source link
[RC18] Agence France Trésor, The State budget — French Budget Bill 2027. Source link
[RC19] Reuters, “France plans €54 billion savings drive as protests grow”, 17 Sep. 2026. Source link
[RC20] Reuters, “Rise in French yields is manageable now, but consolidation pressure might grow, IMF says”, 16 Oct. 2026. Source link
[RC21] OECD, Revenue Statistics 2024 — France country note. Source link
[RC22] Cour des comptes, The State Budget in 2023 — debt interest and borrowing requirement. Source link
Additional sources for the expanded October 25 analysis
[74] Agence France Trésor, June 4, 2026 long-term bond auction: https://www.aft.gouv.fr/en/publications/communiques-presse/04-june-2026-issuance-oats
[75] Agence France Trésor, August 6, 2026 long-term bond auction: https://www.aft.gouv.fr/en/publications/communiques-presse/06-august-2026-issuance-oats
[76] European Commission, “A Well-Crafted BEER: Identifying the Fundamental Drivers of Real Exchange Rates”, July 14, 2026: https://economy-finance.ec.europa.eu/publications/well-crafted-beer-identifying-fundamental-drivers-real-exchange-rates_en
[77] IMF, Drivers of Exchange Rates in EMDEs: Implications for Foreign Exchange Intervention, September 17, 2026 (comparative framework for FX fundamentals and financial shocks, not a euro-area estimate): https://www.imf.org/en/publications/staff-discussion-notes/issues/2026/09/16/drivers-of-exchange-rates-in-emdes-implications-for-foreign-exchange-intervention-578715
[78] ICE, Markit iTraxx Europe Senior Financials Index, 25 European financial entities (index design; complete daily 2026 history restricted): https://www.ice.com/products/28687615
[79] Agence France Trésor, official October 2023 and October 2024 auction results, and October 2025 long-term auction: https://www.aft.gouv.fr/en/publications/communiques-presse/05-october-2023-issuance-oats ; https://www.aft.gouv.fr/en/publications/communiques-presse/03-october-2024-issuance-oats ; https://www.aft.gouv.fr/en/publications/communiques-presse/20251002-issuance-oats
Author and use of AI note
Author note. This article was written and edited by Ismael Diamoutene, founder of SharpeEdge Capital, a quantitative investment firm specializing in digital assets and fiat currencies. The views expressed are the author’s research views and should not be interpreted as investment advice, an offer to sell securities, or a solicitation to invest.
Use of AI. AI tools were used as a research and drafting assistant to help structure the article, refine wording, check consistency, format tables and figures, and prepare the publication-ready document. The data sources, analytical framing, final interpretation, and conclusions were reviewed and selected by the author. Any errors or omissions remain the author’s responsibility.